Abstract After the 3.11 triple disaster, massive information flooded the media. However, a comprehensive picture of the information ecosystem regarding 3.11 is yet to emerge.This article presents a quantitative analysis of a large amount of information and discourses concerning 3.11. In addition to gaps in information about damage and danger, we found that the areas most affected by the triple disaster had a greater number of people lacking access to vital information. These people were not only left behind during the first weeks of the catastrophe, but also thereafter, in the agenda for reconstruction.
Keywords 3.11, Media analysis, Information gap, vulnerability, class
While the full consequences from the triple disaster of March 2011 (hereafter ‘3.11’) are yet to come, the event has already generated an enormous amount of information and discussion, and created confusion in understanding the information ecosystem of the event. In disaster studies, a calamity of this type is regarded as a trigger for social vulnerabilities to rise to the surface. We also have to consider the social structure behind the disaster as summarized by Wisner et al. (2003), and as pointed out by several studies in the case of the Hanshin-Awaji earthquake of 1995, the “reconstruction” might reproduce the previous structural disparities. As emphasized by Beck (1992: 35), the “history of risk distribution shows that, like wealth, risks adhere to the class pattern, only inversely: Wealth accumulates at the top, risks at the bottom. To that extent, risks seem to strengthen, not negate class society.” In other words, the weakest not only benefit less in normal times, they tend also to become the biggest risk receivers in situations of disaster or great hazard such as 3.11.
This article presents a quantitative analysis of a large amount of information and discourses regarding 3.11. First we have collected statistical data about damage from disasters and social conditions of the disaster-hit areas, issued by the local and national governments.1 This procedure was essential to analyzing the basic information and thinking about 3.11. We focused on the 37 coastal municipalities that were worst hit by the tsunami, and we tried to sketch the scope of the damage according to areas and social situations damaged before 3.11.
We then looked at the information flow concerning 3.11 in mass and social media. We draw on quantitative analysis, which includes a frequency analysis and a network analysis focusing on the co-occurrence of keywords (co-word), as well as a content analysis. Co-words and the network structure of co-words have been widely recognized as carriers of meaning and indicators of words in context (e.g. Callon et al. 1983, Braam et al. 1991, Stegman & Grohmann 2003). The method of co-word network analysis in this report depends on previous studies by Leydesdorff and Hellstein (2005, 2006), Salton’s cosine as the similarity index (Salton & McGill 1983, Jones & Fornus 1987), the description of networks by Pajek (Batagelj & Mrvar 1998), the visualizations algorithm of Kamada and Kawai (1989), and Freeman (1979)’s definition of betweenness as the index of centrality.
To begin, we need to recall that the earthquake, tsunami, and nuclear accident caused enormous damage and destruction. There were more than 20,000 cases of deaths and missing as a result of the tsunami. Additionally, at this writing, due to the tsunami and the nuclear accident, there are approximately 290,000 evacuees who are spread all over Japan. In June 2011, the national government estimated total losses for buildings, lifelines, social infrastructure, agriculture, and other damage at about 16.9 trillion yen. The disaster generated over 25 million tons of rubble and general waste.Rough sketch of damages and sites
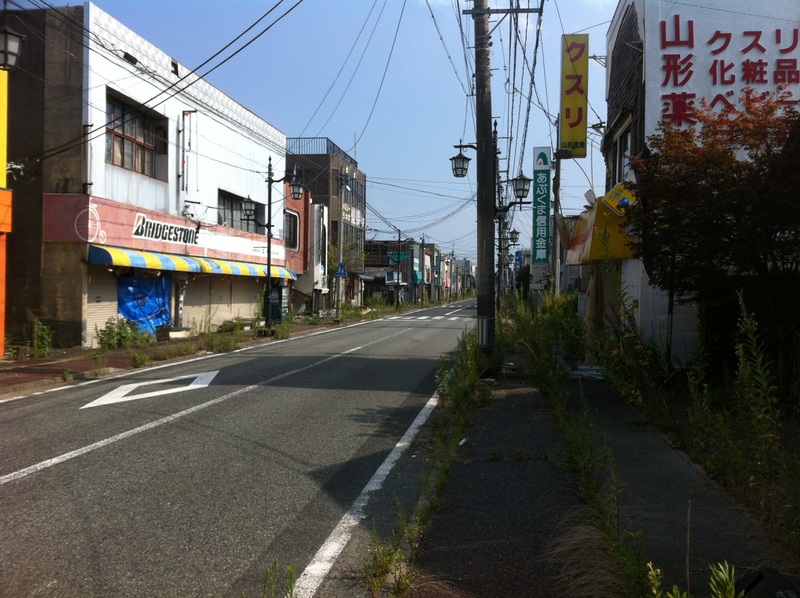 Photo 1. Namie town, damaged by earthquake and abandoned after the Nuclear Power Plant accident (August 19, 2013) |
|
|
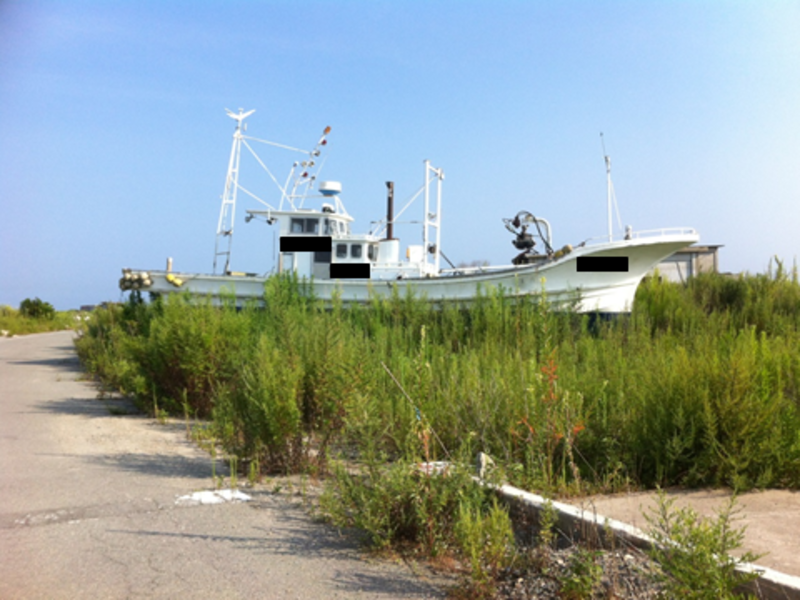
The three prefectures of Miyagi, Iwate, and Fukushima were most affected. Table 1 indicates differences of scale, range, characters, and spectrum of damage according to the area. For example, deaths in the Miyagi prefecture reached over 10,000. Iwate and Fukushima also had several thousand deaths. Drowning from the tsunami caused more than 90 % deaths; approximately 65 % of the victims were over 60 years of age (Cabinet Office 2011). There were also numerous disappearances. This is an important feature of 3.11, which was unseen for example in the Hanshin-Awaji earthquake of 1995. In addition, a significant number of buildings collapsed because of the tsunami and earthquake; the coastline of towns for several hundred kilometers was literally wiped out. In addition, the nuclear accident led to a mandatory evacuation zone forcing thousands of people to leave their towns (particularly in the area of Futaba). While Miyagi prefecture registered a greater number of evacuees, Fukushima prefecture had a high proportion of evacuees outside the prefecture (see Table 1). Some people died on the spot for lack of quick rescue.2 Almost three years later, many of the affected areas along the coast of the Tohoku region still present landscapes of desolation with cars and ships destroyed by the tsunami scattered about (Photos 1-2).
Table 2 shows a breakdown of the damage and social conditions of 37 municipalities on the coastline of the three worst affected prefectures (Miyagi, Iwate, and Fukushima). Local towns in this area feature aging populations, rely heavily on farming and fisheries, and are poorer than in metropolitan areas.
These municipalities, which were already lacking resources before 3.11, subsequently faced deeply indented coastlines with even more people living in narrowly habitable areas.
|
Total population |
Total number of houses |
Population ratio under 15 |
Population ratio from 15 to 64 |
Population ratio over 65 |
Population ratio of primary industry |
Population ratio of secondary manufacturing |
Population ratio of tertiary industry |
Area of municipality |
|
|
Sendai |
1045903 |
530660 |
13.4 |
68.7 |
15.5 |
0.1 |
11.7 |
88.2 |
784 |
|
Ishinomaki |
160704 |
64870 |
14.2 |
64.7 |
25.2 |
1.9 |
25.4 |
72.7 |
556 |
|
Siogama |
56490 |
23250 |
13.3 |
67.0 |
24.7 |
0.6 |
23.7 |
75.8 |
18 |
|
Kesennuma |
73494 |
25670 |
14.2 |
63.4 |
28.5 |
2.4 |
26.3 |
71.4 |
333 |
|
Natori |
73140 |
25820 |
15.0 |
62.4 |
16.2 |
0.1 |
21.5 |
78.4 |
100 |
|
Tagajo |
62979 |
26810 |
15.6 |
68.8 |
15.2 |
0.0 |
18.9 |
81.1 |
20 |
|
Iwanuma |
44198 |
17010 |
15.2 |
66.6 |
17.4 |
0.3 |
25.6 |
74.1 |
61 |
|
Higashi-Matsushima |
42908 |
15450 |
15.3 |
64.8 |
20.6 |
1.6 |
22.7 |
75.7 |
102 |
|
Watari |
34846 |
11520 |
14.3 |
65.8 |
20.7 |
1.6 |
38.2 |
60.2 |
73 |
|
Yamamoto |
16711 |
5310 |
11.8 |
64.8 |
29.4 |
1.2 |
39.5 |
59.3 |
64 |
|
Matsuhima |
15089 |
5560 |
12.2 |
66.2 |
28.6 |
0.7 |
12.7 |
86.6 |
54 |
|
Shichigahama |
20419 |
6650 |
16.1 |
68.2 |
18.8 |
1.5 |
24.6 |
73.9 |
13 |
|
Rifu |
34000 |
11420 |
16.7 |
65.0 |
13.1 |
0.0 |
29.5 |
70.5 |
45 |
|
Onagawa |
10051 |
– |
12.7 |
62.0 |
32.0 |
2.1 |
34.3 |
63.6 |
66 |
|
Minami-Sanriku |
17431 |
5540 |
15.0 |
62.4 |
29.5 |
3.4 |
32.7 |
63.9 |
164 |
|
Rikuzentakada |
23302 |
8550 |
14.0 |
59.7 |
32.3 |
3.0 |
29.3 |
67.6 |
232 |
|
Ofunato |
40738 |
16580 |
14.6 |
62.7 |
28.8 |
2.7 |
27.2 |
70.2 |
323 |
|
Kamaishi |
39578 |
18420 |
13.2 |
61.5 |
33.9 |
1.7 |
28.8 |
69.4 |
441 |
|
Otsuchi |
15277 |
6130 |
14.1 |
63.2 |
30.8 |
2.4 |
34.1 |
63.5 |
201 |
|
Yamada |
18625 |
7950 |
15.1 |
62.7 |
30.3 |
2.5 |
34.1 |
63.3 |
263 |
|
Miyako |
59442 |
25010 |
14.2 |
63.7 |
29.1 |
3.7 |
24.0 |
72.2 |
1260 |
|
Iwaizumi |
10804 |
– |
12.9 |
59.5 |
37.8 |
10.4 |
25.7 |
63.9 |
993 |
|
Tanobata |
3843 |
– |
15.0 |
62.2 |
33.2 |
4.2 |
34.4 |
61.4 |
156 |
|
Fudai |
3088 |
– |
13.6 |
64.8 |
30.3 |
8.6 |
26.4 |
64.9 |
70 |
|
Noda |
4632 |
– |
15.6 |
63.7 |
29.0 |
10.8 |
20.1 |
69.1 |
81 |
|
Kuji |
36875 |
15810 |
16.7 |
64.2 |
25.2 |
3.1 |
28.3 |
68.6 |
623 |
|
Yono |
17910 |
6650 |
15.3 |
64.7 |
29.1 |
8.2 |
27.7 |
64.0 |
303 |
|
Soma |
37796 |
15030 |
15.2 |
62.7 |
24.4 |
1.2 |
38.2 |
60.6 |
198 |
|
Minami-Soma |
70895 |
25050 |
14.6 |
62.9 |
25.2 |
1.6 |
30.7 |
67.6 |
399 |
|
Hirono |
5418 |
– |
15.5 |
63.7 |
23.0 |
1.0 |
41.4 |
57.6 |
58 |
|
Naaraha |
7701 |
– |
16.1 |
64.4 |
25.7 |
1.9 |
36.4 |
61.7 |
103 |
|
Tomioka |
15996 |
6880 |
15.7 |
63.5 |
19.7 |
1.4 |
28.7 |
69.9 |
68 |
|
Okuma |
11511 |
– |
15.3 |
60.8 |
19.4 |
1.3 |
32.3 |
66.4 |
79 |
|
Futaba |
6932 |
– |
14.7 |
63.4 |
25.3 |
0.4 |
42.0 |
57.6 |
51 |
|
Namie |
20908 |
7830 |
14.9 |
63.5 |
24.9 |
1.2 |
30.4 |
68.4 |
223 |
|
Shinchi |
8218 |
– |
15.1 |
62.7 |
26.6 |
3.7 |
38.4 |
57.9 |
46 |
|
Iwaki |
342198 |
147740 |
15.2 |
65.0 |
23.2 |
0.9 |
27.2 |
71.8 |
1231 |
|
Financial capability index |
Municipal income per capita (1000yen) |
Number of death |
Number of destroyed houses |
Death ratio |
Ratio of destroyed houses |
Area of flooded land |
Ratio of flooded area |
Ratio of population living in flooded area |
|
|
Sendai |
0.86 |
2786 |
704 |
68920 |
0.07 |
13.0 |
52 |
6.6 |
2.9 |
|
Ishinomaki |
0.51 |
2108 |
3160 |
22603 |
1.97 |
34.8 |
73 |
13.1 |
69.9 |
|
Siogama |
0.54 |
2218 |
20 |
3466 |
0.04 |
14.9 |
6 |
33.3 |
33.1 |
|
Kesennuma |
0.43 |
1982 |
1007 |
10846 |
1.37 |
42.3 |
18 |
5.4 |
54.9 |
|
Natori |
0.75 |
2491 |
911 |
3719 |
1.25 |
14.4 |
27 |
27.0 |
16.6 |
|
Tagajo |
0.74 |
2627 |
188 |
4693 |
0.30 |
17.5 |
6 |
30.0 |
27.2 |
|
Iwanuma |
0.8 |
2548 |
183 |
2301 |
0.41 |
13.5 |
29 |
47.5 |
18.2 |
|
Higashi-Matsushima |
0.45 |
2114 |
1045 |
10833 |
2.44 |
70.1 |
37 |
36.3 |
79.3 |
|
Watari |
0.59 |
2153 |
257 |
3501 |
0.74 |
30.4 |
35 |
48.0 |
40.4 |
|
Yamamoto |
0.41 |
1964 |
670 |
3256 |
4.01 |
61.3 |
24 |
37.5 |
53.8 |
|
Matsuhima |
0.53 |
2068 |
2 |
1637 |
0.01 |
29.4 |
2 |
3.7 |
26.9 |
|
Shichigahama |
0.61 |
2371 |
66 |
1189 |
0.32 |
17.9 |
5 |
38.5 |
44.8 |
|
Rifu |
0.85 |
2820 |
49 |
637 |
0.14 |
5.6 |
1 |
2.2 |
1.6 |
|
Onagawa |
1.41 |
2228 |
547 |
3276 |
5.44 |
– |
3 |
4.6 |
80.1 |
|
Minami-Sanriku |
0.31 |
1829 |
551 |
3299 |
3.16 |
59.5 |
10 |
6.1 |
80.1 |
|
Rikuzentakada |
0.28 |
1766 |
1549 |
3341 |
6.65 |
39.1 |
13 |
5.6 |
82.5 |
|
Ofunato |
0.43 |
2023 |
337 |
3629 |
0.83 |
21.9 |
8 |
2.5 |
46.8 |
|
Kamaishi |
0.51 |
2409 |
883 |
3723 |
2.23 |
20.2 |
7 |
1.6 |
33.3 |
|
Otsuchi |
0.32 |
1737 |
800 |
3677 |
5.24 |
60.0 |
4 |
2.0 |
78.0 |
|
Yamada |
0.28 |
1698 |
600 |
3184 |
3.22 |
40.1 |
5 |
1.9 |
61.3 |
|
Miyako |
0.36 |
2297 |
420 |
4675 |
0.71 |
18.7 |
10 |
0.8 |
30.9 |
|
Iwaizumi |
0.15 |
1645 |
7 |
197 |
0.06 |
– |
1 |
0.1 |
10.5 |
|
Tanobata |
0.14 |
1510 |
14 |
270 |
0.36 |
– |
1 |
0.6 |
41.2 |
|
Fudai |
0.14 |
1816 |
0 |
0 |
0.00 |
– |
1 |
1.4 |
36.1 |
|
Noda |
0.18 |
1676 |
38 |
478 |
0.82 |
– |
2 |
2.5 |
68.6 |
|
Kuji |
0.39 |
2140 |
2 |
274 |
0.01 |
1.7 |
4 |
0.6 |
19.4 |
|
Yono |
0.23 |
1616 |
0 |
26 |
0.00 |
0.4 |
1 |
0.3 |
15.3 |
|
Soma |
0.56 |
2721 |
454 |
1692 |
1.20 |
11.3 |
29 |
14.7 |
27.6 |
|
Minami-Soma |
0.65 |
2612 |
640 |
5657 |
0.90 |
22.6 |
39 |
9.8 |
18.9 |
|
Hirono |
1.25 |
5641 |
2 |
– |
0.04 |
– |
2 |
3.5 |
25.6 |
|
Naaraha |
1.12 |
4555 |
11 |
50 |
0.14 |
– |
3 |
2.9 |
22.7 |
|
Tomioka |
0.92 |
3939 |
19 |
– |
0.12 |
– |
1 |
1.5 |
8.8 |
|
Okuma |
1.5 |
4835 |
76 |
30 |
0.66 |
– |
2 |
2.5 |
9.8 |
|
Futaba |
0.78 |
4608 |
30 |
63 |
0.43 |
– |
3 |
5.9 |
18.4 |
|
Namie |
0.47 |
2557 |
144 |
– |
0.69 |
– |
6 |
2.7 |
16.1 |
|
Shinchi |
0.86 |
2845 |
108 |
548 |
1.31 |
– |
11 |
23.9 |
56.8 |
|
Iwaki |
0.7 |
2711 |
309 |
21044 |
0.09 |
14.2 |
15 |
1.2 |
9.5 |
|
Table 2. Social structure and damage in 37 municipalities on the coasts of Miyagi, Iwate and Fukushima Prefectures. Sources: See Table 1. |
|||||||||
Gap of information as infrastructure
In addition to gaps in damage and social conditions, the information gap might be considered as one of the most significant issues of 3.11. The spread and access of the Internet enable us to make and use countless amounts of information, a situation that has been reinforced by the appearance of social network services such as Twitter, Facebook, etc. During a disaster, these tools offer a base for sharing information. But as several studies have noted, the myth of a “one hundred million middle class” (ichi oku sōchūryū) cannot be supported by a careful analysis of the disparities of media usage, for which the term “digital divide” only shows one aspect. For example, people with lower social capital use a mobile phone but not a Smartphone or they do not have a PC and despite sometimes playing role games online, they are light Internet users.3 As another example, TV audiences are part-time workers. On the other hand, people with higher social capital hold Smartphones, they are users of tablet PCs and SNS, and so on.
|
|
According to a government report on the current status of Japanese Internet usage (Sōmu-shō 2011), though the coefficient of use remains relatively high for the 60-70 age group (between 57 and 70%), it drops to less than 40% for those over 70, and less than 20% for those over 80 years old. While families with high annual income (over 6 million Yen) have a coefficient use of 80%, this drops to 63% for families earning less than 2 million Yen a year.4 And of course the Tohoku region has a much lower score compared to metropolitan areas. The large majority of Internet users during the disaster and its immediate aftermath were thus in metropolitan areas, while the victims were unable to collect or send information effectively.
|
|
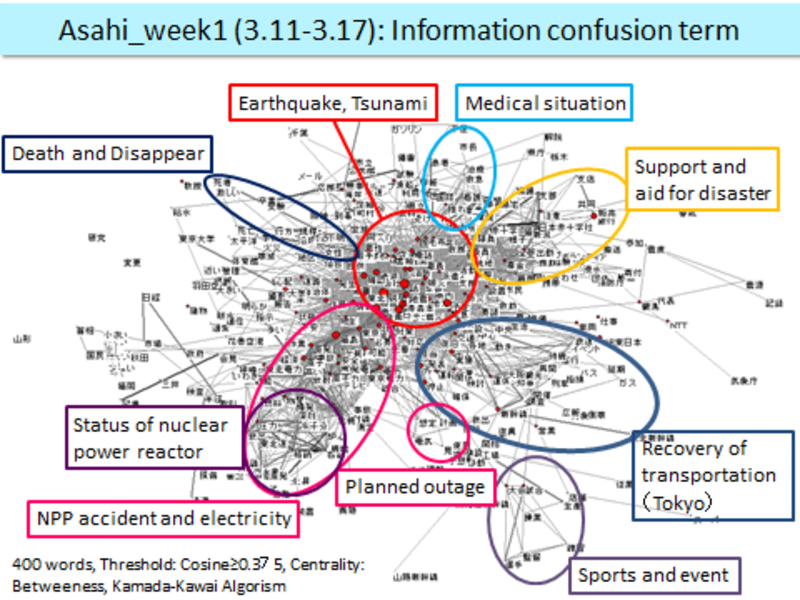
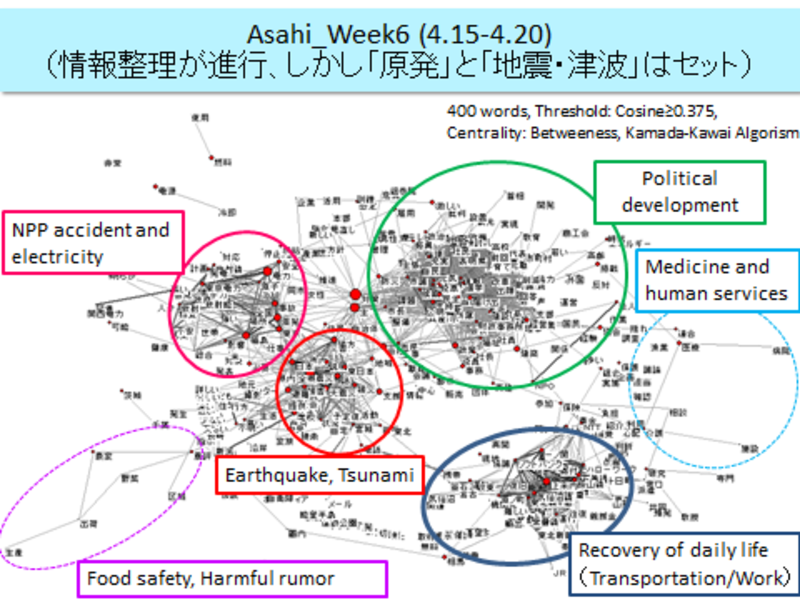
As a means to clarify the consequences of the gap of information for the victims of 3.11, we focused on newspapers, web news, blogs, and Twitter. Figure 1 shows the timeline change of article numbers and appearance of keywords in the Asahi newspaper: the appearance of the word “earthquake” gradually decreased as references to the nuclear accident increased. Looking at the 400 most frequentlyused keywords in each term from March 11 to March 17 (Figure 2), then from March 15 to March 20 (Figure 3), we can find a clear difference in co-word network that represents the degree of the organization of topics. During the first week of the disaster, there was a tremendous confusion of topics and agendas. Furthermore, the keyword cluster around “earthquake and tsunami” networks closely parallels a cluster around “Nuclear Power Plant accident and electricity.” This trend is seen in all co-word networks each week. However, in the co-word network in the sixth week, this close relationship relaxed to some degree.
To evaluate the differences in appearance of topics among newspapers, we conducted a comparison of resonance of agenda, topics and argument between the “big four” Japanese major national newspapers. After a content analysis and classification of arguments, we calculated the Spearman’s Rank Correlation Coefficient (data not shown). The result shows a high correlation between newspapers, which means that there was a resonance of trends in topics. Concerning argumentation level, there was resonance between the liberal pole (Asahi newspaper and Mainichi Newspaper) and the conservative pole (Yomiuri Newspaper and Nikkei).
|
|
If we look at the trends in social media, Figure 4 shows a timeline change in contents uploaded in blog entries. As a result, after a rapid decrease of “earthquake” and “tsunami”, the keywords “radiation exposure” and “nuclear accident” rapidly increased; however, interest in these new topics was not sustained. In summary, interest in the disasters and the nuclear accident has rapidly faded. The remaining and more stable interests have been about “low radiation exposure” and “internal exposure.”
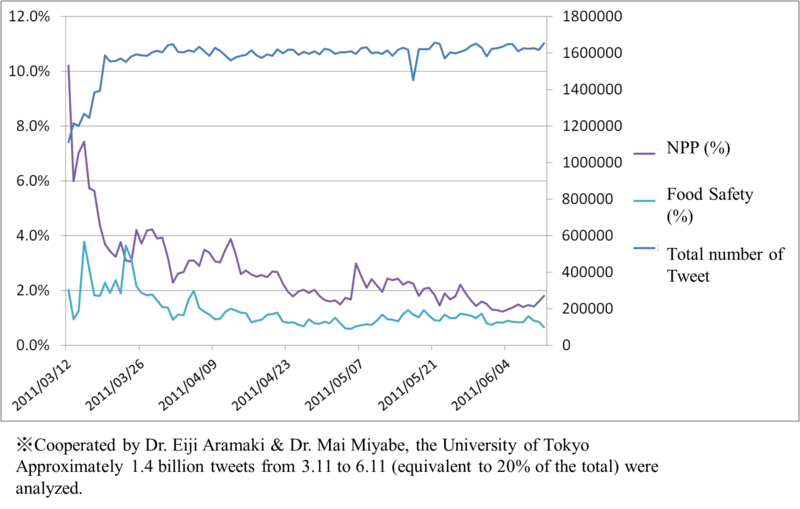
For an analysis of Twitter (Figure 5), we categorized a variety of topics such as “nuclear accident” and “nuclear power policy.” In the aftermath of the accident, tweets regarding the nuclear accident occupied over 10% of all tweets in Japan. However, by the third month after the accident, this had fallen to less than 2%.
Shortly after, in the Internet sphere, there was also a rapid fall in attention to the nuclear accident and 3.11 more generally. Compared to newspapers (Figure 6), web news showed a rapid decrease in topics on the disaster, while there was a simultaneous increase in “entertainment,” “sports,” “economics,” and so on. Although this shift of central topics is common to each media outlet, the difference of degree between the media is clear. One interpretation of this is that as newspapers continued to cover the triple disaster more actively than web news, it sustained public interest. However, as mentioned above, we should not overlook the fact that topics on 3.11 in newspapers had also been mainly occupied by topics regarding “Nuclear Power Plant (NPP).”
|
|
Our analysis suggested several trends in national newspapers: “Decrease of earthquake,” “increase of NPP,” and a dense co-word network between “earthquake and tsunami” and “NPP accident and electricity.” The resonance of agenda and argument in different newspapers was also observed. Our interpretation is that the nuclear accident played a strong, agenda-setting topic and smothered interest in “earthquake and tsunami.” Then the topics on 3.11 themselves decreased rapidly (Figures 4-6).
Discussion: Disaster capitalism and “Reconstruction”
Our report shows significant “gaps” in damage and social conditions in devastated areas. These areas are primary industrial and aging societies. It is possible that local gaps of damage and social conditions caused a lag in reconstruction, like the Matthew effect. Furthermore, the vulnerability and gaps of damage, economy, and reconstruction connect gaps in the variety of resources, information, and access to power. Naomi Klein’s bestseller Shock Doctrine: The Rise of Disaster Capitalism, which was translated and published in Japan in September 2011, looked at the examples of 9.11, the Iraq War, Hurricane Katrina, the Sumatra tsunami and other “disasters” to point out the gap structures that are spread, reinforced, and reproduced in the course of work, and for which the word “reconstruction” is mobilized as a mantra.
|
|
Following on Klein, Tsukahara Togo (2011) called attention to the risk of disaster capitalism in the context of 3.11, taking the case of the Great Hanshin-Awaji earthquake as an emblematic lesson. In the earthquake that hit the city of Kōbe in January 1995, 6,434 individuals died, an outbreak of fire caused the destruction of 7,035 houses and approximately 250,000 houses were seriously damaged. Tsukahara pointed out the two distinct forms of disasters: one was direct damage by earthquake and fires to humans and houses; another was the collapse of the local community and alienation of residents in the course of reconstruction and land readjustment. In the district of Nagata (downtown Kōbe), there were a large number of devastating fires which was ten times greater than that of other seriously affected areas. The damaged area was rapidly reconstructed, and the so-called “Miracle of Nagata” offers new and handsome buildings, streets with new shops, and a monument. Meanwhile more than 30,000 people had definitely left the Nagata area: while in October 1994, the population of Nagata had over 130,000, after the earthquake of January 1995, it rapidly decreased to 96,000. Although the population had somewhat recovered to approximately 108,000 by 1998, population decline continued to 101,000 by 2010. Even though the decrease started before the Hanshin-Awaji earthquake, it is clear that the decrease of population was accelerated by the urban planning launched after the earthquake.
|
|
Statistics suggest the effect of the Hanshin-Awaji earthquake was worse for the poor, the elderly and the disadvantaged, i.e. the most vulnerable. Investigations have pointed out that about 70 % of the residents of Nagata had an annual average income under three million yen (Shinsai fukkō chōsa, 1997; Inoue 2008; Yoshii 2007). According to other studies on the Hanshin-Awaji earthquake (Iwasaki et al. 1999, Tanaka & Shiosaki 2008), before the earthquake most of the residents had their own home, but after the earthquake over 70% of those who came back in the area now lived in rented apartments because they could not afford to rebuild their house. As highlighted by Tsukahara, in the course of the “miracle reconstruction”, there was a widening gap and alienation of inhabitants. In summary, reconstruction and land readjustment after the disaster are closely related with power and politics of economic and urban design.
We can expect a similar process in the case of 3.11. As a contribution to clarifying the social disparities that might be either reinforced or generated by the triple disaster of 3.11, we have chosen to examine the information gap. Previous media studies discussed and theorized the social function of media as “agenda setting,” “agenda building,” “attention cycle,” and so on (e.g., MacCombs & Shaw, 1972; Entman, 1993; Scheufele, 1999). Our focus was rather directed at trends and discourses in the media sphere that affect social agendas and distribution of social resources, capital and public interest. Our hypothesis was that people needed access to a large choice of information and some media activity to participate in agenda setting and the rebuilding process. There were differences of power concerning information, and these differences were, at least partly, defined by gaps of social conditions and damages. We can define those who have been alienated from agenda setting and rebuilding as the information vulnerable.
As we have shown, compared to urban areas, even before the event, the areas that were most affected by the triple disaster of March 11 had a much great number of the information vulnerable. It is obvious that after 3.11, compared to young city dwellers, older people in the devastated areas have had difficultly getting and using information. What is less easy to see is why the victims of the disaster tended to be those who could not collect or discuss information effectively. The information vulnerable were not only left behind during the first weeks of the catastrophe, but also thereafter, in the agenda for “reconstruction”. In comparison with Hanshin earthquake which happened at a time when the diffusion of the Internet was only starting, the paradox is that despite the illusion of a greater distribution of information, we also discern greater disparities of access to relevant information.
In addition, there were gaps in the information taken up by the mass media. At least in national newspapers, interest was rapidly directed to the NPP accident, while in the electronic media the earthquake and tsunami faded into the background. Then, not only were victims of the tsunami relegated to a secondary role, but there was also a rapid decrease in media attention to the range of issues of 3.11. Comparative analysis between national and local newspapers would probably reinforce that analysis.
So far, we have not seen any social mobilization to reverse the balance of power between the most heavily damaged areas, with their comparatively poor and aging population, and urban Japan. We can therefore expect the information gap to widen and bring negative effects during “reconstruction.” The phenomenon that needs to be addressed here is much more than a “digital divide” between those who can “enjoy” Internet and its vast amount of information, and those who don’t: if the existence of such a divide is now well accepted, we have yet to fully understand the myriad consequences for those affected by disasters such as big earthquakes and such a complex mix as 3.11.
Shineha Ryuma is Assistant Professor at the Graduate University for Advanced Studies, Kanagawa. Tanaka Mikihito is Associate Professor at Waseda University, Tokyo.
Shineha Ryuma and Tanaka Mikihito have studied the media discourses regarding life-science, science journalism, and science & technology policy. They have published a book in Japanese on 3.11 (The Disaster Vulnerable and the Vulnerable) and a book chapter in Science Information and Politics after the Disaster of March 11 in Japan edited by Nakamura Masaki (see the full references in the list supra).
Recommended Citation: Shineha Ryuma and Tanaka Mikihito, “Mind the Gap: 3.11 and the Information Vulnerable,” The Asia-Pacific Journal, Vol. 12, Issue 7, No. 4, February 17, 2014.
Related articles
This article is part of 3.11 + 3: Special Issue on Japan’s Triple Disaster Three Years On edited by Paul Jobin and David McNeill. Other articles include:
David McNeill and Paul Jobin, Introduction
Philip C. Brown, Call it A ‘Wash’? Historical Perspectives on Conundrums of Technological Modernization, Flood Amelioration and Disasters in Modern Japan
Kyle Cleveland, Mobilizing Nuclear Bias: The Fukushima Nuclear Crisis and the Politics of Uncertainty
Yasuhito ABE, Safecast or the Production of Collective Intelligence on Radiation Risks after 3.11
1 We collected information from official issues, which were published by the Reconstruction Agency, the Cabinet Office, the Statics Bureau of the Ministry of Internal Affairs and Communications, and local governments of Miyagi, Iwate, and Fukushima Prefectures.
2 For example, a surgeon who conducted autopsies of victims said several victims died from starvation after suffering leg injuries and receiving no help in the evacuated area around the plant. (Asahi-Shimbun, May 25, 2012).
3 See: 中央調査社 (Central Survey Society), パーソナル先端商品の利用状況 (Current situation on the use of personal electronic commodities), April 2012: www.crs.or.jp/data/pdf/ptg2012.pdf
And: D.A. Consortium, スマートフォン・iPad・一般携帯電話に関する利用実態調査 2010(Survey on the use of Smartphones, iPad and average mobile phones): http://www.dac.co.jp/Contents/pdf/press/20100924_sp_research.pdf
4 To be precise, the coefficient use is 70.1% for those aged 60–64, 57% for the group 65–69, 39.2% for the group 70–79 and 20.3% for those over 80 years old; 63.1%, for the families with annual income under 2 million Yen, 68.6% for those between 2 and 4 million Yen, 80% for those over 6 million Yen.
References
Asahi Shinbun (2012). Purometeusu no wana: kenshō Fukushima genpatsu jiko no shinjitsu 2 (Prometheus trap: Verifying the true facts on the Fukushima nuclear accident 2), Gakken Publishing. プロメテウスの罠-検証福島原発事故の真実 2、学研.
Batagelj, V., A.Mrvar (1998). Pajek: A program for large network analysis. Connections, 21(2), 47-57.
Beck, Ulrich (1992). Risk Society: Towards a New Modernity. New Delhi: Sage.
Braam, R.R., H.F.Moed, and A.F.J.Van Raan (1991). Mapping of science by combined co-citation and word analysis. I. Structural Aspects. Journal of the American Society for Information Science, 42(4), 233–251.
Callon, M., J.-P. Courtial, W.A. Turner, S. Bauin (1983). From translations to problematic networks: An introduction to co-word analysis. Social Science Information, 22, 191-235.
Callon, M., J.-P. Courtial, F. Laville (1991). Co-word analysis as a tool for describing the network of interactions between basic and technological research: The case of polymer chemistry. Scientometrics, 22(1), 155-205.
Entman, Robert, M. (1993). ‘Framing: Toward Clarification of a Fractured Paradigm, Journal of Communication 43/4: 51-58.
Freeman, L.C. (1979). Centrality in social networks conceptual clarification. Social Networks, 1(3), 215-239.
Hirata Nao平田直, Satake Kenji佐竹健治, Meguro Kimio目黒公郎, Hatamura Yōtarō畑村洋太郎 (2011). Kyodai jishin kyodai tsunami ─ Higashinihon daishinsai no kenshō 巨大地震・巨大津波-東日本大震災の検証 (Big earthquake, big tsunami: investigation on the Tōhoku earthquake and tsunami) Asakurashoten朝倉書店.
Kamada, T., S.Kawai (1989). An algorithm for drawing general undirected graphs. Information Processing Letters, 31(1), 7-15.
Klein, Naomi (2007). The Shock Doctrine: The Rise of Disaster Capitalism: Metropolitan Books.
Inoue Setsuko いのうえせつこ(2008). Jishin wa hinkon ni osoikakaru -`Hanshin Awaji daishinsai’ shisha 6437 nin no sakebi地震は貧困に襲いかかる-「阪神・淡路大震災」死者6437人の叫び (The earthquake hits the poor: The cry of the 6,437 dead of the Hanshin-Awaji earthquake). Kadensha 花伝社.
Iwasaki Nobuhiko岩崎信彦, Itō Atsuko伊藤亜都子, Ōhara Michiko大原径子, Tokuda Tsuyoshi徳田剛 (1999). Gekijin hisai-chi ni okeru jūtaku saiken no genjō to kadai: Hanshin daishinsai 4-nen-me no fukkō kukaku seiri jigyō: Takatori Higashi chiku no jirei激甚被災地における住宅再建の現状と課題: 阪神大震災4年目の復興区画整理事業: 鷹取東地区の事例 (The State and Problem of Housing Reconstruction in a Heavily Stricken Areas: The case study of Takatori-Higashi district in the 4th year from the Great Hanshin Earthquake), 神戸大学都市安全研究センター研究報告 (Report of Research Center for Urban Safety and Security Kobe University) 3, 313-322.
Leydesdorff, L. (1997). Why words and co-words cannot map the development of the sciences. Journal of the American Society for Information Science, 48(5), 418-427.
Leydesdorff, L., I. Hellsten (2005). Metaphors and diaphors in science communication: Mapping the case of ‘stem-cell research’. Science Communication, 27(1), 64-99.
Leydesdorff, L., I. Hellsten (2006). Measuring the meaning of words in contexts: An automated analysis of controversies about ‘Monarch butterflies,”Frankenfoods,’ and ‘stem cells’. Scientometrics, 67(2), 231-258.
MacCombs, Maxwell E., and D.L. Shaw (1972). The Agenda-Setting Function of Mass Media. Public Opinion Quarterly 36(2), 176-187.
Mullins, N., W. Snizek, W. and K.Oehler (1988). The structural analysis of scientific paper, pp. 85–101. In A. F. J Van Raan (Eds.), Handbook of Quantitative Studies of Science & Technology, Amsterdam: Elsevier.
Naikakufu内閣府 (Cabinet Office) (2011). Heisei 23 nendo bōsai hakusho (White Paper on Disaster prevention) 『平成23年度防災白書』<link>
Nakamura Masaki et al. (2013). Posuto 3.11 no kagaku to seijigaku (Science and Politics after 3.11), Nakanishiya Press. 中村征樹 (編)『ポスト3.11の科学と政治』:ナカニシヤ出版。
Salton, G., and M. J. Mcgill (1983). Introduction to modern information retrieval. Auckland, etc., McGraw-Hill.
Scheufele, Dietram, A. (1999). Framing as a Theory of Media Effects’, International Communication Association 49: 103-22.
Stegmann, J. and G.Grohmann (2003). Hypothesis generation guided by co-word clustering. Scientometrics, 56(1), 111-135.
Shinsai fukkō chōsa kenkyū iinkai震災復興調査研究委員会 (Research Committee on the reconstruction after the earthquake disaster) (1996). Hanshin Awaji daishinsai fukkōshi阪神・淡路大震災復興誌第1巻 (Journal of the earthquake of Hanshin-Awaji. Vol.1), 21st Century Hyogo Creative Association 21世紀ひょうご創造協会.
Sōmu-shō総務省 (Ministry of Internal Affairs and Communications) 2010. Heisei 22 nendo Tsūshin riyō dōkō chōsa平成22年度通信利用動向調査 (Annual report 2010 on the trends of information and communication use).<link>
Tanaka Masato田中正人, Shiozaki Yoshiaki塩崎賢明 (2008). Yōto konzai chiku no fukkō kukaku seiri jigyō ni okeru tenshutsu jittai to sono haikei ‐ Kōbe-shi o Suga nishi chiku ni okeru kēsusutadi用途混在地区の復興区画整理事業における転出実態とその背景‐神戸市御菅西地区におけるケーススタディ (The Realities and Background of the Moving-out of Residents after the Land Readjustment Project in a Mixed Use District: Case of Misuga-nishi district, Kobe city). Journal of architecture, planning and environmental engineering日本建築学会計画系論文集, 73(629): 1529-36.
Tanaka Mikihito田中幹人, Shineha Ryuma標葉隆馬, Maruyama Kiichirō丸山紀一朗 (2012). Saigai jakusha to jōhō jakusha: 3 11 Ato, nani ga misugosa reta no ka災害弱者と情報弱者: 3・11後、何が見過ごされたのか (The Disaster Vulnerable and the Information Vulnerable: What was overlooked after 3.11?). Chikuma Shobō筑摩書房.
Tsukahara Togo塚原東吾 (2011). Saigai shihon shugi no hatsudō: nido hakai sareta Kōbe kara nani o manabu no ka? 災害資本主義の発動-二度破壊された神戸から何を学ぶのか?(Variation on disaster capitalism: What can we learn from the second destruction of Kobe?) Gendai shisō現代思想39(7): 202-11.
Urano Masaki浦野正樹 (2007). Saigai shakaigaku no kiro: saigai taiō no gōri-teki seigyo to chiiki no seijakusei no keigen災害社会学の岐路-災害対応の合理的制御と地域の脆弱性の軽減 (The crossroads of disaster sociology: Reducing the regional vulnerabilities and a reasonable control of disaster response), pp. 35-41, in Introduction to disaster sociology災害社会学入門, edited by Oyane Atsushi 大矢根淳, Urano Masaki浦野正樹, Tanaka Atsushi 田中淳, Hiroaki Yoshii 吉井博明. Kōbundō 弘文堂.
Voakes, Paul S., Jack Kapfer, David Kurpius and David Shano-yeon Chern (1996). Diversity in the news: A conceptual and methodological framework, Journalism and Mass Communication Quarterly 73 (Autumn): 582-593.
Wisner Ben, Blaikie Piers, Cannon Terry, Davis Ian (2003). At Risk: Natural Hazards, People’s Vulnerability and Disasters(Second Edition): Routledge.
Yoshii Hiroaki吉井博明 (2007). Saigai e no shakai-teki taiō no rekishi災害への社会的対応の歴史 (The history of social responses to disaster) pp. 57-66, in Saigai shakaigaku nyūmon災害社会学入門 (Introduction to disaster sociology), edited by Oyane Atsushi 大矢根淳, Urano Masaki浦野正樹, Tanaka Atsushi田中淳, Hiroaki Yoshii吉井博明. Kōbundō弘文堂.

