
Pope Francis’s encyclical Laudato Si (Praise Be to You) has created headlines worldwide for identifying environmental destruction and global inequality as the “two evils” afflicting humanity today.
My latest book, Nature and Wealth: Overcoming Environmental Scarcity and Inequality , similarly argues that the world economy today is facing two major threats:
- increasing environmental degradation, and
- a growing gap between rich and poor.
Drawing on historical and contemporary evidence, I argue that these two threats are symptomatic of a growing structural imbalance in all economies, which is how nature is exploited to create wealth and how it is shared among the population. The root of this imbalance is that natural capital is under-priced, and hence overly exploited, whereas human capital is insufficient to meet demand, thus encouraging relatively higher wages for skilled labor and resulting wealth inequality.
Our economic wealth consists of three main assets: reproducible capital, human capital and natural capital, which also includes ecological capital. Along with financial assets, economic wealth comprises the overall wealth of countries, which is often referred to as national wealth. In recent decades, financial capital has become the dominant form of wealth, and more of the income and wealth of the rich is from the financial sector. Moreover, its unchecked expansion has led to greater financial risk and instability, increasing concentration of wealth and global imbalances. Reproducible capital continues to be overly resource- and energy-intensive, and is the main conduit for skill-biased technological change. As a result, accumulation of reproducible capital encourages more use of natural capital and rising demand for relatively skilled labor. However, human capital accumulation in modern economies, that is the development of a skilled labor force, is failing to keep pace with this demand, which has caused the wage gap between highly skilled and less-skilled workers to grow. The outcome globally is increasing wealth inequality, pockets of poverty, structural unemployment, and increased social polarization.1 Finally, the under-pricing of natural capital has led to increasing over-use and severe environmental degradation. The result is increasing pressure on ecological and natural resources, signaling the emergence of global environmental problems such as climate change and declining freshwater availability.
One reason for this imbalance is that the current structure of production in the world economy has been mainly determined by the second phase of innovations of the Industrial Revolution. These innovations occurred from 1870 to 1900, and were based largely on electricity and the internal combustion engine, which were in turn made possible by the new hydrocarbons oil and gas, along with coal. Harnessing these technological and economic changes eventually led to the rise of the United States as the leader in 20th century industrialization. As industrialization spread worldwide, fostered by trade in energy and resources, there was a large boost to global productivity, which lasted until the1970s.
This second phase of the Industrial Revolution was also an outcome of the fossil fuel era. Since the 1890s, coal, oil and gas have accounted for at least half of global energy consumption. And, despite the rise in renewable energy and nuclear power, fossil fuels still account for 80% of energy use worldwide. In addition, as economies became more energy-intensive during the second phase, they also increased non-renewable material use, such as minerals and ores, construction materials and nonrenewable organics, which currently comprise 95% of material consumption.
Two long-term trends that accompanied the second phase of industrialization have occurred since the early 20th century: skill-biased technological change and increased resource and energy use. Both trends are fundamental to understanding the structural imbalance that has arisen since the 1970s.
Moreover, economies today are exacerbating this imbalance. We hide the rising costs of increasing environmental scarcity by continuing to under price natural and ecological capital. And, rather than investing in sufficient human capital to keep pace with skill-biased technological change, we allow skilled labor to become scarce and thus attract excessive wages. It seems that we are prepared to accept the economic and social consequences of excessive environmental degradation and rising wealth inequality.
This argument is especially relevant to Asian economies. A few examples illustrate these problems across the region.
Carbon Dependency in the Asia-Pacific Region
In modern economies, carbon dependency is the attribute most associated with successful wealth accumulation. As economies grow and become wealthier, they consume more fossil fuels and non-renewable materials, all of which release large amounts of carbon dioxide (CO2) and other carbon-based “greenhouse gas” (GHG) emissions, such as methane, nitrous oxides and various fluoro-carbons. In effect, ever since the mid-19th century, the spread of industrialization and the rise of the global fossil fuel era have ensured that all economies have become structurally dependent on fossil fuel energy and non-renewable material use, which in turn has made them highly carbon dependent. Certainly, the leading industrial countries, such as the United States, Japan, Western European countries, Australia and Canada, have been carbon dependent for a long time, and still emit much of the world’s GHG emissions today. But increasingly it is the largest, most populous and fastest growing developing economies, such as China, India, Russia, Brazil, Mexico and Indonesia, which have equaled, and in some cases surpassed, the aggregate emission levels of rich countries. Overall, as countries strive to industrialize, grow quickly and accumulate wealth, they cannot help but become more carbon dependent.
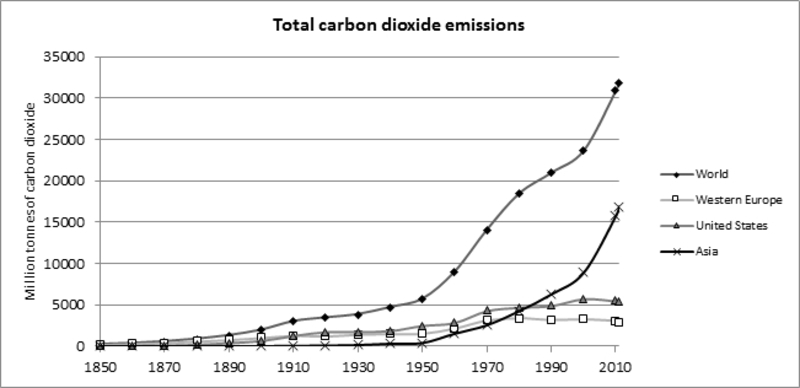
Figure 1 depicts the changing regional pattern of carbon emissions in the world economy for over 150 years, from 1850 to 2011.

Figure 1. Carbon Dioxide Emissions by Region, 1850-2011 Western Europe includes Austria, Belgium, Denmark, Finland, France, Germany, Greece, Ireland, Italy, Luxembourg, Netherlands, Portugal, Spain, Sweden and United Kingdom. Total carbon dioxide emissions in million tonnes of carbon dioxide (MtCO2) excluding land use change and forestry. Emissions in 1850: World 197 MtCO2, Western Europe 174 MtCO2, United States 20 MtCO2 and Asia 0.02 MtCO2. Emissions in 1900: World 1,934 MtCO2, Western Europe 1,011 MtCO2, United States 663 MtCO2 and Asia 27 MtCO2. Emissions in 1950: World 5,698 MtCO2, Western Europe 1,520 MtCO2, United States 2,493 MtCO2 and Asia 401 MtCO2. Emissions in 2000: World 23,631 MtCO2, Western Europe 3,249 MtCO2, United States 5,748 MtCO2 and Asia 8,890 MtCO2. Emissions in 2011: World 31,855 MtCO2, Western Europe 2,939 MtCO2, United States 5,333 MtCO2 and Asia 16,870 MtCO2. Source: Climate Analysis Indicators Tool (CAIT) 2.0. ©2014.World Resources Institute, Washington, DC, available here. |
This pattern reflects the spread of global industrialization and the rise of the fossil fuel era. Since the 1950s, the rapid industrialization of major economies in Asia – first Japan and South Korea and followed more recently by China, India, Malaysia and Indonesia – has led this region to become the major global emitter in aggregate GHG emissions. In 2011, Asia produced nearly 17,000 MtCO2, which is more than double the combined emissions of the US and Western Europe (about 8,300 MtCO2), and well over half of the global total of around 32,000 MtCO2 (see Figure 2).
Two other indicators can also be employed to reflect the degree of greenhouse gas levels of an economy: greenhouse gas intensity and per capita greenhouse gas emissions. Greenhouse gas intensity is a measure of how much GHG is emitted to produce a dollar’s worth of goods and services produced each year by an economy. Per capita GHG emissions are the total annual emissions of an economy divided by the total population, thus giving an indication of the amount of GHGs emitted per person.
Table 1 indicates that over 1990 to 2011 the GHG intensity fell in the “Group of 20” (G20) major economies, and across the world generally.2
Table 1. Global Greenhouse Gas Intensity, 1990-2011
| Total GHG Emissions Per ANNI (tCO₂e / Million $ ANNI) | Average annual growth | Total growth | Ratio to world 2011 | Ratio to US 2011 | |||
| 1990 | 2011 | Change | |||||
| China | 6,556 | 3,141 | -3,415 | -2.5% | -52.1% | 3.1 | 6.2 |
| United States | 799 | 504 | -295 | -1.8% | -36.9% | 0.5 | 1.0 |
| European Union | 606 | 345 | -261 | -2.1% | -43.1% | 0.3 | 0.7 |
| India | 3,502 | 2,065 | -1,437 | -2.0% | -41.0% | 2.0 | 4.1 |
| Russia | 4,755 | 2,527 | -2,229 | -2.2% | -46.9% | 2.5 | 5.0 |
| Indonesia | 8,657 | 6,256 | -2,402 | -1.3% | -27.7% | 6.1 | 12.4 |
| Brazil | 3,488 | 1,475 | -2,013 | -2.7% | -57.7% | 1.4 | 2.9 |
| Japan | 340 | 322 | -18 | -0.2% | -5.2% | 0.3 | 0.6 |
| Canada | 954 | 802 | -152 | -0.8% | -15.9% | 0.8 | 1.6 |
| Germany | 577 | 307 | -270 | -2.2% | -46.8% | 0.3 | 0.6 |
| Mexico | 925 | 881 | -44 | -0.2% | -4.8% | 0.9 | 1.7 |
| South Korea | 741 | 695 | -46 | -0.3% | -6.3% | 0.7 | 1.4 |
| Australia | 1,308 | 906 | -403 | -1.5% | -30.8% | 0.9 | 1.8 |
| United Kingdom | 605 | 259 | -347 | -2.7% | -57.3% | 0.3 | 0.5 |
| Saudi Arabia | .. | .. | .. | .. | .. | .. | .. |
| France | 354 | 235 | -120 | -1.6% | -33.8% | 0.2 | 0.5 |
| Italy | 380 | 321 | -59 | -0.7% | -15.5% | 0.3 | 0.6 |
| South Africa | 2,468 | 1,816 | -651 | -1.3% | -26.4% | 1.8 | 3.6 |
| Argentina | 3,045 | 2,280 | -765 | -1.2% | -25.1% | 2.2 | 4.5 |
| Turkey | 756 | 682 | -74 | -0.5% | -9.8% | 0.7 | 1.4 |
| G20 total | 1,064 | 879 | -185 | -0.8% | -17.4% | 0.9 | 1.7 |
| Rest of world | 3,535 | 2,133 | -1,402 | -1.9% | -39.7% | 2.1 | 4.2 |
| World | 1,301 | 1,030 | -271 | -1.0% | -20.8% | 1.0 | 2.0 |
Estimates of greenhouse gas (GHG) emissions, which are measured in million tonnes of carbon dioxide equivalent (MtCO2e), include land use change and forestry.
In 2011, world GHG emissions consisted of carbon dioxide (CO2, 73.6% of total), methane (CH4, 16.5%), nitrous oxide (N2O, 8.5%), hydrofluorocarbons (HFCs, 1.0%), perfluorocarbons (PFCs, 0.3%) and sulfur hexafluoride (SF6, 0.2%). GHG emissions from Climate Analysis Indicators Tool (CAIT) 2.0. ©2014.World Resources Institute, Washington, DC, available here.
Adjusted net national income (ANNI) is national income adjusted for both reproducible and natural capital depreciation (net forest, energy and mineral depletion), from World Bank, World Development Indicators available here.
G20 is the Group of 20 countries. The members of the G20 include 19 countries (Argentina, Australia, Brazil, Canada, China, France, Germany, India, Indonesia, Italy, Japan, Mexico, Russia, Saudi Arabia, South Africa, South Korea, Turkey, the UK and the US), plus the European Union. The G20 total excludes Germany, United Kingdom, France and Italy, as their emissions are already included in the European Union aggregate.
In 2011 the GHG intensity of the large emerging market economies was substantially higher than for the United States and rich nations generally, and in some cases, the world average. For example, the GHG intensity of Indonesia was six times the world average and twelve times the US average, GHG intensity in China was three times the world average and six times the US level, in India two times the world average and four times that of the US, and in Russia 2.5 times the world average and five times the GHG intensity of the United States.
Over 1990-2011, per capita GHG emissions rose across all G20 countries, due mainly to the rise in many large emerging market members, especially those in Asia (see Table 2).
Table 2. Global Greenhouse Gas Emissions Per Capita, 1990-2011
| Total GHG emissions per capita (tCO₂e per person) | Average annual growth | Total growth | Ratio to world 2011 | Ratio to US 2011 | |||
| 1990 | 2011 | Change | |||||
| China | 2.7 | 7.6 | 4.9 | 8.8% | 184.4% | 1.2 | 0.4 |
| United States | 22.8 | 19.7 | -3.1 | -0.7% | -13.7% | 3.0 | 1.0 |
| European Union | 10.6 | 8.5 | -2.1 | -1.0% | -20.2% | 1.3 | 0.4 |
| India | 1.2 | 1.9 | 0.7 | 3.0% | 62.0% | 0.3 | 0.1 |
| Russia | 21.1 | 15.5 | -5.6 | -1.3% | -26.5% | 2.4 | 0.8 |
| Indonesia | 6.0 | 8.4 | 2.4 | 1.9% | 39.7% | 1.3 | 0.4 |
| Brazil | 11.6 | 7.2 | -4.4 | -1.8% | -38.0% | 1.1 | 0.4 |
| Japan | 9.1 | 9.2 | 0.1 | 0.0% | 0.7% | 1.4 | 0.5 |
| Canada | 21.5 | 24.7 | 3.2 | 0.7% | 14.9% | 3.7 | 1.3 |
| Germany | 13.9 | 9.9 | -4.1 | -1.4% | -29.3% | 1.5 | 0.5 |
| Mexico | 5.0 | 6.1 | 1.0 | 1.0% | 20.2% | 0.9 | 0.3 |
| South Korea | 6.1 | 13.2 | 7.0 | 5.5% | 114.9% | 2.0 | 0.7 |
| Australia | 25.6 | 26.6 | 1.0 | 0.2% | 3.9% | 4.0 | 1.4 |
| United Kingdom | 13.0 | 8.5 | -4.4 | -1.6% | -34.1% | 1.3 | 0.4 |
| Saudi Arabia | 12.3 | 19.2 | 6.8 | 2.6% | 55.5% | 2.9 | 1.0 |
| France | 8.7 | 7.1 | -1.6 | -0.9% | -18.3% | 1.1 | 0.4 |
| Italy | 8.3 | 7.5 | -0.7 | -0.4% | -9.0% | 1.1 | 0.4 |
| South Africa | 9.4 | 8.9 | -0.5 | -0.3% | -5.8% | 1.3 | 0.5 |
| Argentina | 9.5 | 10.7 | 1.2 | 0.6% | 12.6% | 1.6 | 0.5 |
| Turkey | 3.4 | 5.1 | 1.7 | 2.5% | 51.6% | 0.8 | 0.3 |
| G20 Average | 11.1 | 11.9 | 0.8 | 0.3% | 7.1% | 1.8 | 0.6 |
| World | 6.3 | 6.6 | 0.2 | 0.2% | 3.9% | 1.0 | 0.3 |
Estimates of greenhouse gas (GHG) emissions per capita, which are measured in tonnes of carbon dioxide equivalent (MtCO2e) per person, include land use change and forestry.
In 2011, world GHG emissions consisted of carbon dioxide (CO2, 73.6% of total), methane (CH4, 16.5%), nitrous oxide (N2O, 8.5%), hydrofluorocarbons (HFCs, 1.0%), perfluorocarbons (PFCs, 0.3%) and sulfur hexafluoride (SF6, 0.2%).
G20 is the Group of 20 countries. The members of the G20 include 19 countries (Argentina, Australia, Brazil, Canada, China, France, Germany, India, Indonesia, Italy, Japan, Mexico, Russia, Saudi Arabia, South Africa, South Korea, Turkey, the UK and the US), plus the European Union. The G20 average excludes Germany, United Kingdom, France and Italy, as their emissions are already included in the European Union average.
Source: Climate Analysis Indicators Tool (CAIT) 2.0. ©2014.World Resources Institute, Washington, DC, available here.
Per capita emissions in Argentina, Brazil, China, Indonesia and South Africa reached 7-11 tonnes per person, matching the levels among some rich countries, such as Japan and many European countries. In South Korea, per capita emissions exceed 13 tonnes per person, in Russia over 15 tonnes per capita, and in Saudi Arabia more than 19 tonnes per person, the latter reaching the US level. In large emerging market economies, especially in Asia, per capita emissions are growing faster than in rich countries.
With the exception of Australia, Canada and Japan, the high-income G20 countries were able to reduce per capita GHG emissions over 1990-2011. But there may be structural limits on how much further these countries can reduce emissions per person. For example, Japan and European countries had the lowest per capita GHG emissions among rich economies in 1990. The European countries reduced per capita emissions slightly by 2011 while Japan’s per capita emissions remained roughly stable. This suggests that it may be difficult to reduce per capita GHG emissions in high-income economies beyond 7-8 tonnes per person.
Global Implications
The continuing carbon dependency of large emerging market and rich economies, especially in Asia, is worrisome in several respects.
First, there is compelling scientific evidence that failure to check aggregate GHG emissions could result in irreversible global climate change.3 The resulting changes in global temperatures and precipitation are likely to contribute to sea level rise, and disrupt freshwater availability, ecosystems, food production, coastal populations and human health.
Second, the rich and large emerging economies that are responsible for most GHG emissions are likely better able to adapt to the impacts of climate change than many low income developing countries, according to recent evidence on how economic production may shift globally due to higher temperatures.4 The world’s poor are especially vulnerable to the climate-driven risksposed by rising sea level, coastal erosion and more frequent storms. Around 14% of the population and 21% of urban dwellers in developing countries live in low elevation coastal zones that are vulnerable to these risks.5 The livelihood of billions – from poor farmers to urban slum dwellers – are threatened by a wide range of climate-induced risks that affect food security, water availability, natural disasters, ecosystem stability and human health. For example, many of the 150 million urban inhabitants who are likely to be at risk from extreme coastal flooding and sea level rise are the poor living in developing country cities.6 It is estimated that ten cities in developing countries will account for 67% of the future coastal population exposure to the risks from sea-level rise and storm surge.7 All ten of these cities are located in the Asia-Pacific region: Manila, Karachi, Jakarta, Khulna, Calcutta, Bangkok, Chittagong, Ho Chi Minh City and Yangon. Just 15 developing countries, which include India, Bangladesh, Myanmar, Cambodia, Pakistan, China, Indonesia, the Philippines, Vietnam and Thailand, contain around 90% of the world’s low-elevation coastal zone rural poor, who are highly vulnerable to the future risks to coastal GDP, agriculture and wetlands from sea-level rise and storm surge intensification.8 Millions more poor inhabitants of drylands and other water-stressed agricultural areas will suffer from the risks and economic consequences of future climate change.
Third, if economies continue to become more carbon-dependent as they develop and become richer, this does not bode well for controlling the growth in future GHG emissions. Given that many high-income economies are experiencing falling per capita emissions, and their populations are not expected to grow significantly, these countries will contribute less to overall global emissions. Instead, if future growth in aggregate GHG is to be slowed, “the bulk of the decreases in emissions will have to come from developing countries, especially those that are now catching up with the industrialized world, and that still have population growth to boot.”9 This will not happen as long as low and middle-income countries continue to emulate the carbon-dependent development path of today’s rich, large and more successful economies.
The Concentration of Wealth
Much attention in recent years has focused on the highly concentrated distribution of wealth in many economies, and especially among the so-called “one percent” of the population that is super-rich, i.e. the wealthiest 1% of all adults, and still more the top 0.1%. Most analysts agree that, although data on long-run trends are available for only a handful of countries, the wealth of the super-rich has been increasing since the early 1970s for some economies and since 1980 for others.10 More importantly, worldwide:
- the top 1% today account for almost half of all the wealth in the world,
- the richest 10% own 87% of all assets, and
- the bottom half of the global population possess less than 1% of global wealth.11
For example, just over 3 billion people in the world, nearly 70% of the world’s population, have wealth of less than US$10,000.12 Among this group, 90% are located in Africa and Asia. In comparison, people who are millionaires or richer comprise less than 1% of the population yet they own 44% of global assets. Within this group, 128,200 individuals have wealth of more than US$50 million, 45,200 have over US$ 100 million, and 4,300 have assets above US$500 million. Of these wealthy individuals, 90% live in Europe, North America and the Asia-Pacific (excluding China and India). Thus, the division between the very wealthy and the very poor is affecting every region, including within and among economies in the Asia-Pacific.
However, it is the recent rise in wealth inequality – and its spread throughout the world economy and especially throughout Asia – that is the most significant trend. Table 3 depicts the level of inequality in 46 major economies, and also indicates whether the level has been rising or falling from 2000 to 2014.
Table 3. Trends in Wealth Inequality across Countries, 2000-2014
| Change in wealth share of the top decile, 2000-2014 | |||||||
| Rapid fall | Fall | Slight fall | Flat | Slight rise | Rise | Rapid rise | |
| Top decile wealth share, 2014 | |||||||
| > 70%
Very high inequality (US ca. 1910) |
Malaysia
Philippines |
Switzerland | Peru
South Africa Thailand United States |
Brazil
Indonesia |
Argentina
Egypt Hong Kong India Russia Turkey |
||
| > 60%
High inequality (US ca. 1950) |
Poland
Saudi Arabia |
Colombia
Mexico |
Denmark
Germany |
Austria
Norway Sweden |
Chile | Czech Republic
Israel |
China
South Korea Taiwan |
| > 50%
Medium inequality (Europe ca. 1980) |
Canada
France New Zealand Singapore |
Australia
Finland Greece Ireland Italy Netherlands Portugal |
United Arab Emirates | United Kingdom | Spain | ||
| < 50%
Low inequality |
Japan | Belgium | |||||
The top decile is the wealthiest 10% of all adults.
46 countries, with the Group of 20 (G20) countries indicated in italics. The members of the G20 include 19 countries (Argentina, Australia, Brazil, Canada, China, France, Germany, India, Indonesia, Italy, Japan, Mexico, Russia, Saudi Arabia, South Africa, South Korea, Turkey, the UK and the US), plus the European Union.
Source: Markus Stierli, Anthony Shorrocks, Jim Davies, Rodrigo Lluberas and Antonios Koutsoukis. 2014. Global Wealth Report 2014. Credit Suisse Research Institute, Zurich, Table 1, p. 30 and Table 2, p. 33.
Wealth inequality is high or very high in 30 of these countries. Moreover, since 2000, nine countries have experienced a rapid rise in inequality, five have seen a rise, and three a slight rise. Among these countries are several from the Asia-Pacific: Indonesia, Hong Kong, India, China, South Korea and Taiwan. What is more, with the exception of Japan, all Asia-Pacific countries listed in Table 3 display medium, high or very high inequality.
A Parable from Beijing
The example of Beijing’s air pollution – and the stark contrast between how the rich and poor are able to respond to this problem – illustrate how environmental degradation and economic inequality are becoming increasingly entwined in Asian economies.
Beijing is one of the largest and fastest growing cities in the world. Its current population is more than 20 million, and the population is expected to exceed 25 million by 2020 and possibly 50 million by 2050.13 Beijing’s extraordinary growth, together with that of other such megacities as Shanghai and Chongqing, has been accompanied by industrial development, greater reliance on coal-fired power plants, increased automobile traffic and congestion, urban sprawl, and as a consequence, notoriously high levels of air pollution. Over a six-year period, from April 2008 to March 2014, there were 1,812 days where air quality in Beijing reached unhealthy levels, and only two days where air quality exceeded healthy levels.14 Pollution exposure in Beijing and other urban areas in China is linked to cardio-respiratory illnesses and premature deaths, in particular from heart disease, stroke and lung cancer.15 In January 2015, the city’s mayor made global headlines by announcing that, because of its noxious smog, “Beijing is not a livable city.”16
But there is a great difference in how the rich and poor residents of Beijing are able to cope with its air pollution. In Beijing and other major Chinese cities, it is the disadvantaged groups – the poor, ethnic minorities and rural migrants – that are most exposed to air pollution and the resulting health effects.17 These disadvantaged groups are confined to the most polluted urban neighborhoods, which also suffer from high crime rates, inadequate infrastructure and services, and poor living conditions, from which they commute long distances for work. Moving closer to work is not an option; 48% of all jobs in Beijing are located within three miles of the city center, yet only the rich that can afford to live downtown.18
In addition, the rich have other options for coping with Beijing’s air pollution and other health and social problems.19 They can afford to move to cleaner urban neighborhoods, which also have better jobs and high-quality public services, such as good schools and hospitals. The very wealthy can also afford extraordinary measures to protect themselves from air pollution. For example, elite private schools in Beijing are building gigantic inflatable air-conditioned domes to protect their students from air pollution hazards as they play sports and attend classes. As one school official explains: “A non-toxic learning environment is perhaps the least parents might expect, when they’re paying £20,000-a-year fees.”20 Moreover, increasingly many of Beijing’s wealthy send their children overseas to school, not least to protect their health.
A Balanced Wealth Strategy
As I argue in my book, Nature and Wealth, to address the current structural imbalance we must tackle these twin problems of excessive environmental degradation and insufficient human capital, which I call a Balanced Wealth Strategy. This strategy also needs to include policies aimed directly at benefiting the large number of resource-dependent economies and ending the significant pockets of poverty found worldwide. In addition, global market failures – climate change, loss of ecosystems and declining availability of water – need to be addressed as well.
Consequently, the four key elements of the Balanced Wealth Strategy are:
- Ending the persistent under-pricing of natural capital that leads to its over-use in all economies.
- Ending insufficient human capital accumulation that contributes to increasing wealth inequality.
- Adopting policies targeted at inefficient natural resource use and poverty in developing economies.
- Creating markets to address key global environmental impacts, such as climate change, loss of key ecosystems, and management of transboundary water resources.
The Balanced Wealth Strategy is clearly not costless, and will require substantial commitments by all economies. But unless such a strategy is pursued, and the world economy makes the transition to a new era of innovation and environmentally and socially sound growth, the current global threats of environmental scarcity and inequality will continue to worsen. In the case of Asia’s dynamic economies, such a strategy offers the opportunity to transition to green innovation and growth.21
In sum, we face two possible visions of the future, one in which the second phase malaise persists versus one in which the world economy enters a third phase of innovation, sustainable growth and economic prosperity. Making the transition will not be easy, but the consequences for the majority of the world’s population of the current pattern of depleting nature to accumulate wealth could be bleak, if not catastrophic. The Asia-Pacific region in particular must confront this choice sooner rather than later. A good place to start doing so would be at the forthcoming climate change negotiations at the UN Framework Convention on Climate Change meetings in Paris in early December.
Recommended citation: Edward B. Barbier, “Overcoming Environmental Degradation and Wealth Inequality in the Asia-Pacific Region”, The Asia-Pacific Journal, Vol. 13, Issue 46, No. 1, November 16, 2015.
Related articles
• Andrew DeWit, Japan’s Bid to Become a World Leader in Renewable Energy
• John Mathews and Hao Tan, A ‘Great Reversal’ in China? Coal continues to decline with enforcement of environmental laws
• John A. Mathews and Hao Tan, The Greening of China’s Black Electric Power System? Insights from 2014 Data
• John A. Mathews and Hao Tan, “China’s Continuing Renewable Energy Revolution: Global Implications”
• John A. Mathews and Hao Tan, “Jousting with James Hansen: China building a renewables powerhouse”
• John A. Mathews, The Asian Super Grid
• Andrew DeWit, Japan’s Energy Policy at a Crossroads: A Renewable Energy Future?
• Sun-Jin YUN, Myung-Rae Cho and David von Hippel, The Current Status of Green Growth in Korea: Energy and Urban Security
Notes
1 There is now considerable evidence of this process, as documented in E.B. Barbier, 2015. Nature and Wealth: Overcoming Environmental Scarcities and Inequality. Palgrave MacMillan, London. Although the strongest evidence of the growing income and wealth gap in recent decades between relatively high compared to low-skilled workers in the economy is for the United States, it appears that other economies have been experiencing similar trends. For example, the Organization for Economic Cooperation and Development (OECD). 2011. An Overview of Growing Income Inequalities in OECD Countries: Main Findings. Divided We Stand: Why Inequality Keeps Rising. OECD, Paris, p. 31 found that “the evolution of earnings inequality across OECD countries over the past few decades could be viewed mainly as the difference between the demand for and supply of skills… the outcome of a ‘race between education and technology’.” Similarly, as developing economies increasingly adopt the skill-biased technologies of advance economies and the demand for skilled labor rises globally, there is also increasing pressure of the relative wages of skilled workers and inequality worldwide. See, for example, E. Berman and S. Machin. 2000. “Skill-biased technology transfer around the world.” Oxford Review of Economic Policy 16(3):12-22; Florence Jaumotte, Subrir Lall and Chris Papageorgiou. 2013 “Rising Income Inequality: Technology, or Trade and Financial Globalization?” IMF Economic Review 61(2):271-309; E. Lee and M. Vivarelli, eds. 2006. Globalization, Employment, and Income Distribution in Developing Countries. Palgrave Macmillan, London; E. Meschi and M. Vivarelli. 2009. “Trade and Income Inequality in Developing Countries.” World Development 37:287-302. Thus, the rising demand for skilled labor, and the subsequent inequality in income earnings and wealth, appears to be a global phenomenon.
2 The members of the G20 include 19 countries (Argentina, Australia, Brazil, Canada, China, France, Germany, India, Indonesia, Italy, Japan, Mexico, Russia, Saudi Arabia, South Africa, South Korea, Turkey, the UK and the US), plus the European Union.
3See, for example, Intergovernmental Panel on Climate Change (IPCC) Working Group II. 2014. Climate Change 2014: Impacts, Adaptation, and Vulnerability. Saunders, Philadelphia.
4 Marshall Burke, Solomon Hsiang and Edward Miguel. 2015. “Global non-linear effect of temperature on economic production.” Nature.
5 G. McGranahan, D. Balk, D. and B. Anderson. 2007. “The rising tide: assessing the risks of climate change and human settlements in low elevation coastal zones.” Environment and Urbanization 19(1): 17-37.
6 R.J. Nicholls, , Hanson, S., Herweijer, C., Patmore, N., Hallegatte, S. Corfee-Morlot, J., Chateua, J. and Muir-Wood, R. 2007. Ranking of the World’s Cities Most Exposed to Coastal Flooding Today and in the Future: Executive Summary. OECD Environment Working Paper No. 1. OECD, Paris. See also Organization for Economic Cooperation and Development (OECD). 2008. Costs of Inaction on Key Environmental Challenges. OECD, Paris and United Nations Development Programme(UNDP). 2008. Human Development Report 2007/2008. Fighting Climate Change: Human Solidarity in a Divided World. UNDP, New York.
7 H. Brecht, Dasgupta, S., Laplante, B., Murray, S. and Wheeler, D. 2012. “Sea-Level Rise and Storm Surges: High Stakes for a Small Number of Developing Countries.” The Journal of Environment and Development 21:120-138.
8 Edward B. Barbier. 2015. “Hurricane Katrina’s lessons for the world.” Nature 524:285-287 and Edward B. Barbier. 2015. “Climate change impacts on rural poverty in low-elevation coastal zones.” Estuarine, Coastal and Shelf Science, published online doi:10.1016/j.ecss.2015.05.035
9 Edward B. Barbier and Anil Markandya. 2012. The New Blueprint for a Green Economy. Routledge/Taylor & Francis, London, p. 19.
10 See, for example, Facundo Alvaredo, Anthony B. Atkinson, Thomas Piketty, and Emmanuel Saez. 2013. “The Top 1 Percent in International and Historical Perspective.” Journal of Economic Perspectives 27:3-20, and Markus Stierli, Anthony Shorrocks, Jim Davies, Rodrigo Lluberas and Antonios Koutsoukis. 2014. Global Wealth Report 2014. Credit Suisse Research Institute, Zurich. The ten countries with long-term wealth inequality data that are the focus of the latter report are Australia, Denmark, Finland, France, the Netherlands, Norway, Sweden, Switzerland, the United Kingdom and the United States. Alvaredo et al. (2013) also analyze long-term trends for Canada and Japan, but not Denmark, Finland, the Netherlands, Norway and Switzerland.
11 Stierli et al. (2014), op. cit., p. 13.
12 Stierli et al. (2014), op. cit., Figure 1, p. 24, Figure 4, p. 26, and pp. 24-26.
13 “Beijing Population 2014”, World Population Review, October 19, 2014.
14 Based on air quality monitoring data released by the U.S. Embassy Beijing, as reported in Lily Kuo. “Six years of Beijing air pollution summed up in one scary chart.” Quartz April 10, 2014.
15 Avraham Ebenstein, Maoyong Fan, Michael Greenstone, Guojun He, Peng Yin and Maigeng Shou. 2015. “Growth, Pollution, and Life Expectancy: China from 1991-2012.” HKUST IEMS Working Paper No. 2015-10, February 2015.
16 As reported by Jonathan Kaiman. “Beijing smog makes city unliveable, says mayor.” The Guardian 28 January 2015.
17 Chunbo Ma. 2010. ‘Who bears the environmental burden in China – An analysis of the distribution of industrial pollution sources?” Ecological Economics 69:1859-1875; Ethan D. Schoolman and Chunbo Ma. 2012. “Migration, class and environmental inequality: Exposure to pollution in China’s Jiangsu Province.” Ecological Economics 75:140-151; Siqi Zheng and Matthew E. Kahn. 2013. “Understanding China’s Urban Pollution Dynamics.” Journal of Economic Literature 51(3):731-772.
18 Zheng and Kahn (2013), op. cit., pp. 746-747. Ironically, when air pollution regulations are enforced, it is also the less-skilled workers in urban and surrounding areas whose incomes are most affected by the reduction in industrial and mining jobs; see “The cost of clean air.” The Economist February 7th 2015.
19 Zheng and Kahn (2013), op. cit.
20 Oliver Wainwright. “Inside Beijing’s airpocalypse – a city made ‘almost uninhabitable’ by pollution.” The Guardian 16 December 2014.
21Edward B. Barbier. 2015. “Policies to Promote Green Economy Innovation in East Asia and North America.” STI Policy Review 6(1):54-69.