The New York Times has recently carried two important stories on China’s coal consumption, indicating that the situation is even more serious than previously appeared to be the case. On November 3 the NYT carried a front page report that China has revised its estimates of how much coal it has been burning, and concluding that its carbon emissions have been higher than had been previously reported and assumed (“China burns much more coal than reported, complicating climate talks”, Nov 3 2015). This was then widely taken up, with the emphasis invariably on the “new fact” that China’s coal burning is higher than previously reported. Then on November 11 the NYT carried a second story concerning a glut of new coal-fired power plant approvals, with the implication that again carbon emissions were likely to be higher in future than previously anticipated (“Glut of coal-fired plants casts doubt on China’s energy priorities”, Nov 11 2015) This second story followed similar reports from both Deutsche Bank and from Greenpeace East Asia.1 Given the global significance of energy and emissions data from China, we explore some of the causes and implications of these developments.
1. Coal burning and energy estimates revision
Firstly, let’s consider the revision of China’s coal burning estimates for past years. It is true that China’s statistical agencies have revised upwards their data for primary energy consumption (measured in terms of coal-equivalent) and for raw coal consumption. These revisions were contained in the China Energy Statistical Yearbook 2014, which was published on 1st Aug 2015, and some of the revised data first appeared in the China Statistical Abstract 2015 which was issued in May 2015 without fanfare by the Chinese or any international comment by the NYT or anyone else. According to the National Bureau of Statistics (NBS) of China, the revised data are based on the results of the 2013 National Economic Census which better captured national economic data, especially data from small and medium-sized enterprises. This was only the third such Census carried out since 1949 after the country decided to combine previous sector-based censuses into comprehensive national economic censuses. The first National Economic Census was carried out in 2004 and the second one in 2008.
Several questions have been the subject of speculation in international media such as the NYT as well as the research community since the new data emerged regarding the discrepancies between the original and revised energy data. First, did the Chinese government deliberately conceal or fabricate previous energy data? Second, what are the implications of the new data for statistical analysis of Chinese emissions including the extent to which previously published analysis requires revision? And third, to what extent do the new data assist in understanding the extreme level of pollution threatening China, especially its cities which have suffered from yet another wave of smog over the past few days.
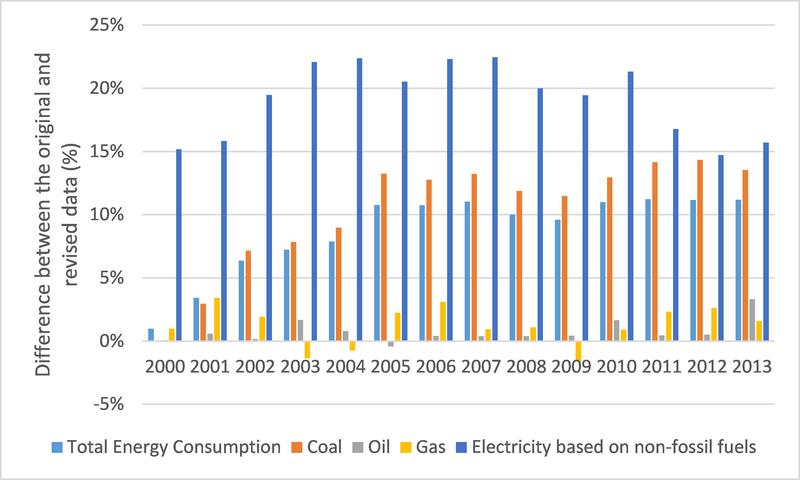
Rather than indicating that China had been ‘hiding’ some of the data on its coal consumption – as implied by the NYT article and made explicit in much of the follow-up commentary – we suggest that this is rather a result of poor quality control in collecting and compiling energy data at the national, provincial and local levels, an issue that has long been noticed by both Chinese and international researchers and is widely viewed as a systemic problem within Chinese data collection (Guan, et al. 2012). On the positive side, however, the revision is a strong indication that the Chinese government is prepared to allow the less favorable data to be published without hindrance. The Chinese government seems prepared to release data more clearly indicative of the dimensions of the problem of curbing greenhouse gas (GHG) emissions. One could think of this as having the effect, for example, of strengthening both domestic and international forces for curbing GHG by revealing that pollution levels were higher than previously reported even as renewables provided an increased share of energy production. Our view on this is reinforced when one considers that the same revision of energy data also carries an upward estimate of non-fossil energy consumption (in terms of coal-equivalent), of a magnitude in fact greater than that for coal in percentage terms– as shown in Fig. 1. This means that had the Chinese been ‘concealing’ their bad coal consumption data, by under-reporting levels of coal consumption, they would at the same time have been under-reporting their usage of renewable energy sources – hardly plausible if political correctness had been the goal. It is interesting that the NYT and other Western reports focused exclusively on under-reported coal consumption and ignored the underreporting of renewable sources, indeed they ignored China’s renewable efforts entirely.
We plot the proportional variation in data for primary energy consumption from various sources, over the years 2000 to 2013 which have been subject to correction, in Fig. 1.
Source: authors based on data from the NBS
Fig. 1 reveals that estimates of coal consumption have been under-reported with figures for actual totals revised upward by between 0 and 14% in the years between 2000 and 2013. But what has not been widely discussed (or mentioned at all) is that non-fossil fuel consumption has also been under-reported by between 15% and 22% over the same period. For example, 50 million of energy generated from non-fossil fuel sources including hydroelectricity, nuclear and wind power was underreported in the year 2012 alone. While China has been burning more coal than previously reported, it has also been generating more power from water, wind and sun than previously reported. In other words, while the continued growth of coal consumption is indeed alarming, it is also notable that increased consumption of energy based on non-fossil fuels was substantially greater in the years 2000 to 2010 and slightly greater in the years 2011-13 (Fig. 1). We shall return to the 2015 data in a moment.
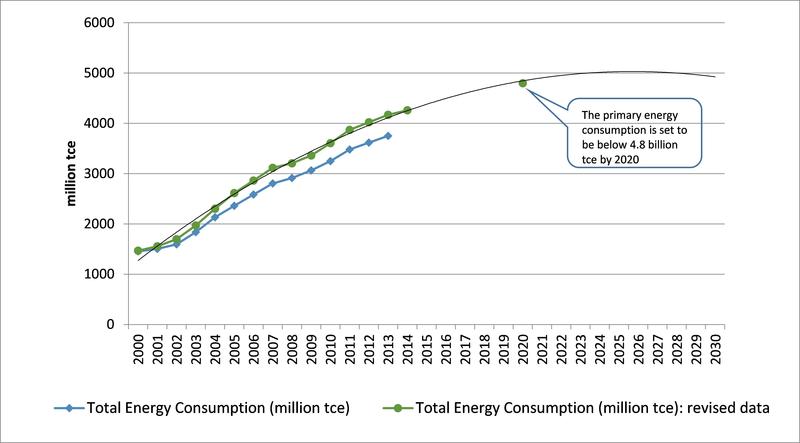
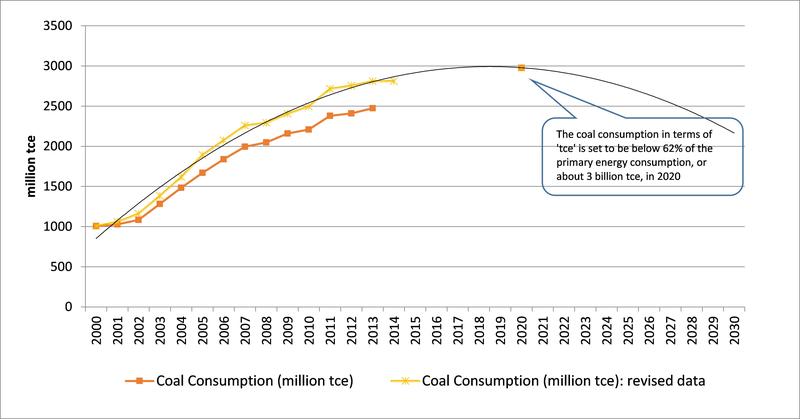
In terms of actual increases in the total energy and the coal consumption, there are several data series to consider. The first concerns the total energy consumption of the country, measured in terms of coal-equivalent. In Fig. 2 we show the new estimates of total energy consumption (in tonnes of coal-equivalent), and in Fig. 3 we show coal consumption again in the energy unit of tce. In both of the charts we plot the original data published in the previous 2013 Energy Yearbook and the revised data in the latest 2014 Energy Yearbook. As shown in Fig. 2, even with the adjustments, the expected curve for total energy consumption in the next five years still approximates the official target of 4.8 billion tce by 2020 (where we provide an extrapolation of the curve based by us on a quadratic function).2 So the upward revision of past data points does not disturb the 2020 target for primary energy consumption. Similarly, it is also reasonable to expect that the official target for coal consumption in tonnes of coal-equivalent, i.e. 62% of the total energy consumption or about 3 billion tce by 2020, can still be met even with the new data (Fig. 3).
Source: authors based on data from the NBS and other government documents
Exploring the data further reveals that the difference between the revised and original total energy data is mainly attributable to the increases in the reporting of energy use in three energy-intensive industries, namely basic chemical and chemical product manufacturing, non-metallic mineral product manufacturing, and iron and steel manufacturing. The upward revision of energy consumption in those three industries, accounting for 55, 84, and 77 million tce respectively, contribute no less than 53% of the total increase between the original and revised energy consumption of the country in 2012.
For the coal consumption in terms of tonnes coal equivalent (tce), the most significant revision occurs in the coal mining and coal washing industry, which has a revised coal consumption in 2012 of 146 million tce (accounting for almost 25% of the discrepancy between original and revised figures for coal consumption in tonnes of coal-equivalent). This is followed by the discrepancies in basic chemical and chemical product manufacturing (80 million tce of coal, or 14% of the total difference), non-metallic mineral product manufacturing (13% of the total difference) and electric power generation (11% of the total difference).
Source: authors based on data from the NBS and other government documents
The substantial revision of energy use data in those energy-intensive industries would likely be a result of the previous underreporting of capacity additions in those industries. For example, the documentary ‘Under the Dome’ released early this year suggests that a large number of small steel mills and coal mines in China were built without official approvals. Consequently they are unlikely to report their energy usage properly if at all. On the other hand, with the enforcement of environmental laws3 as well as the economic slowing down, many of those industries recently faced significant declines. In the steelmaking industry, for example, one of us has argued that the crisis facing the industry reflects a structural change and has passed its production peak.4
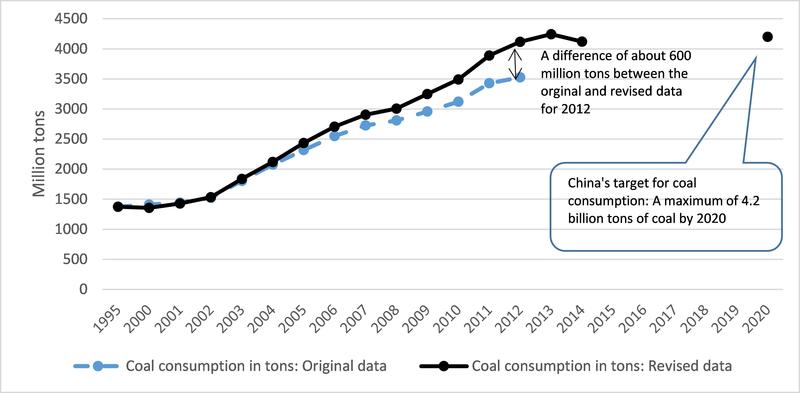
But the real interest of the NYT, and of everyone else, is in the upward estimates of raw coal consumption, which we indicate in Fig. 4. This shows raw coal consumption in its original form as the blue line, and revised coal consumption data as the black line. The increased estimate of raw coal consumption for 2012 adds up to a figure of 4.1 billion tonnes – as compared with the original figure of 3.5 billion tonnes of raw coal consumption. This is how the NYT arrived at its figure of an upward revision of 600 million tonnes of coal burnt in the same year (the difference between 3.5 Gt and 4.1 Gt). Thus we agree with the NYT on the scale of China’s correction for its coal consumption.
Source: authors based on China Energy Statistical Yearbook 2013 and China Energy Statistical Yearbook 2014. Note that the 2014 figure is estimated by the authors based on a statement in the 2014 National Economic and Social Development Statistics Bulletin released in Feb 2015 that “coal consumption in 2014 decreased by 2.9% from the 2013 level”. While the statement needs to be taken with caution given the revision of the energy data, we believe the information is still indicative, especially given that the compilation of the data in the Bulletin appears to have taken the latest results from the 3rd Census into account.
China’s target is to use less than 4.2 billion tons of coal per year by the year 2020. However, according to revised data, the raw coal consumption in 2013 already reached 4.24 billion tons. There seem to be only two options now for China. One is to reduce the use of coal from its 2013 level, which would represent the ‘peak’ of coal consumption of the country in that case; or to revise its official target.
The coal consumption for 2014 can only be estimated indirectly. As explained in the note for Fig 4, we refer to the statement provided by a separate document, the 2014 National Economic and Social Development Statistics Bulletin, and estimate that the raw coal consumption for 2014 would have been about 4.12 billion tons. This figure is subject to further examination when new official data is released. As a result of the estimate, the trend in which coal consumption falls year on year is not changed by the revision of energy data. The official target for coal consumption which has been set at a maximum of 4.2 billion tonnes by 2020, would still seem to be eminently achievable if the falling trend continues.
2. Energy efficiency revisions
China has been emphasizing its adherence to energy efficiency gains specified as targets in the current 12th FYP covering the years from 2011 to 2015. The evident trend towards a decoupling of China’s energy consumption from its economic growth appears to survive the revision of energy data. According to the information revealed by the NBS, the GDP figures would have also been adjusted upward based on the census data. The exact revision of GDP data is unknown at this stage, 5 but according to the 2015 Statistics Abstract which also takes the census results into consideration, the energy elasticity (the ratio of the change in energy consumption to the change in GDP) has been well below 1 since 2005 — and continues to fall (Fig 5). An elasticity of energy consumption below 1 implies the decoupling of energy consumption from economic growth. Comparing the revised data in energy elasticity and the original data, the differences seem very small, and almost negligible since 2012 (refer to the orange bars in Fig 5).
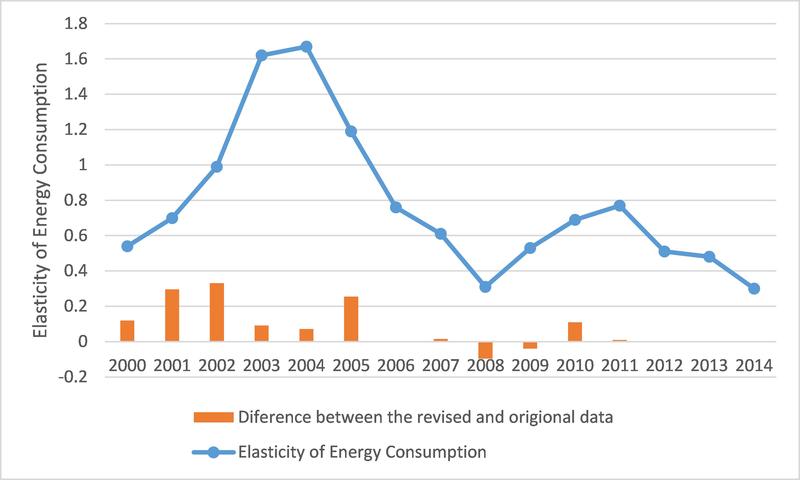
Source: authors based on data from the NBS
3. China’s electricity generation data for 2015 and new thermal generation approvals
In our opinion the more pressing issue is that of China’s recently reported approval of new coal burning electric power generation projects, as revealed in the most recent story in the NYT and as previously covered in a report from Deutsche Bank and separately from Greenpeace East Asia. First let us offer some good news. Data for the first three quarters of 2015 from the China Electricity Council indicate that once again the growth of new generating capacity based on water, wind and sun greatly exceeds the growth of new capacity based on burning fossil fuels. The data are shown in Table 1. Note in particular that generating capacity powered by wind grew to 108.9 GW, up 28.3 % over the 2014 level, while capacity powered by solar grew by 61.4% above the level in 2014 – compared with growth of just 6.8% in fossil fuel burning capacity. Thus the trend towards China’s greening of its electric power system at the margin (in terms of addition of new capacity) continues strongly.
Now the bad news. There has been a spurt in planning approvals for new thermal (fossil fuel burning) capacity. It represents a significant increase in numbers of approvals and scale of construction of thermal power stations, with the implication that there will be increases in carbon emissions in the next three to five years when those power stations start to operate. The NYT story focused on the fact that 155 new thermal power stations had been approved, largely by provincial governments, adding a further 123 GW of new capacity to existing coal-burning power capacity.
According to a Chinese media report 6, by September 2015 an even worse figure of about 200 GW of thermal power capacity had been granted provisional approval, with the projects being cleared to carry out preparatory work. The actual construction will of course be subject to further conditions, however. There are some estimates that those new investments, if carried through to full realization, would create considerable over capacity (of the order of 200 GW) and thereby a significant carbon emissions problem – even worse than that reported by the NYT.
Table 1 Electric power capacity by the end of Sep 2015
| Total capacity by the end of Sep 2015 (GW) | Growth compared with the 2014 level | |
| Thermal | 947 GW (including 855 GW coal-based power generating capacity) | 6.8% |
| Wind | 108.85 GW | 28.3% |
| Solar | 33.92 GW | 61.4% |
| Hydro | 274 GW * | |
| Nuclear | 24 GW |
* Note: only the hydro plants with a capacity over 6MW are included.
In our view, the increase seems to be driven by two major factors. First, the fall in the price of coal means that margins are superior in coal-based electricity generation and hence there is greater financial incentive for investment by companies and governments alike. Such development provides new evidence that China should create mechanisms to counteract the economic incentive derived from the fall in coal price, perhaps by implementing a carbon tax in some form (as now announced). Second, a reform in 2014 shifted the locus of approval from the national level (through the National Development and Reform Commission (ND&RC;)) to the local level, through provincial governments. Since local governments have a strong incentive to create new investments and new power sources, the new projects are now more likely to be approved. Of course there is scope for the national government to intervene once the implications of this shift in locus of approvals becomes more widely known and appreciated. We agree with the emphasis that the NYT placed on the fact that it is provincial governments that are mainly responsible for the surge in new coal-fired plant approvals.
4. China’s green and black energy trajectory
In our own work on China’s energy trajectory, we have emphasized that there are parallel tracks, one being the coal-burning ‘black’ trajectory (with its growth getting smaller each year, with absolute reduction in 2014) and the other the ‘green’ track involving non-fossil pathways and in particular the strictly renewable pathway based on water, wind and sun (whose net additions are expanding each year). Do the revisions to the energy data have any impact on our argument?
Actually our data for coal consumption have mainly been taken from the US Energy Information Agency (EIA). The revisions to China’s energy data have yet to be reflected in the data on China published by the EIA, but in the interests of accurate reporting, we are revising our basic chart on China’s ‘black face’, to show the new levels of total coal consumption – as depicted in Fig. 6.

Source: Mathews and Tan (2015), based on data from the US EIA and the NBS, China, and the China Electricity Council
Our data points for total coal consumption in this chart are now shifted upwards (the new data points are shown in red above the old data points in black). Note again that the trend towards lower coal consumption in 2014 is preserved – in agreement with the recent Greenpeace report. 7
In closing, we have always emphasized that China’s energy production and consumption patterns with the current dependence on fossil fuels (largely coal) is a large ship that will take considerable time to turn around. But turning is what the ship is doing – as disclosed by the greening at the margin, where net additions to generating capacity, to new investment and to electricity generated all reveal green sources outstripping the black. China has every incentive to pursue such a course grounded in enhancing its energy security and in reducing levels of particulate pollution that create unbearable smog. The new data on China’s past coal consumption levels mean that the black picture we have always painted has been even blacker than we imagined. But it would be quite mistaken to project these data revisions as meaning that China has been ‘found out’ in seeking to minimize its past coal consumption. On the contrary it reveals a greater openness and preparedness to allow the data to be published, irrespective of what it shows; indeed the new data encourages greater pressure to be brought to bear on major GHG-emitting industries to reform their practices. And we note that the new data reveal not only that coal consumption was under-reported – but also that dependence on renewable sources (hydro, wind, sun) has been under-reported as well – a boon for China and the world. It is China’s preparedness to be more open and transparent in its energy data that gives us greater confidence that the reported trends towards a greening of the system are real trends and not just statistical artefacts.
Recommended citation: John Mathews and Hao Tan, “The Revision of China’s Energy and Coal Consumption Data: A preliminary analysis”, The Asia-Pacific Journal: Japan Focus, Vol. 13, Issue 46, No. 2, November 16, 2015.
Related articles
• Andrew DeWit, Japan’s Bid to Become a World Leader in Renewable Energy
• John Mathews and Hao Tan, A ‘Great Reversal’ in China? Coal continues to decline with enforcement of environmental laws
• John A. Mathews and Hao Tan, The Greening of China’s Black Electric Power System? Insights from 2014 Data
• John A. Mathews and Hao Tan, “China’s Continuing Renewable Energy Revolution: Global Implications”
• John A. Mathews and Hao Tan, “Jousting with James Hansen: China building a renewables powerhouse”
• John A. Mathews, The Asian Super Grid
• Andrew DeWit, Japan’s Energy Policy at a Crossroads: A Renewable Energy Future?
• Sun-Jin YUN, Myung-Rae Cho and David von Hippel, The Current Status of Green Growth in Korea: Energy and Urban Security
References
Guan, D., Liu, Z., Geng, Lindner, S. & Hubacek, K. (2012) The gigatonne gap in China’s carbon dioxide inventories. Nature Climate Change 2, 672-675.
Greenpeace (2015) Is China doubling down on its coal power bubble? Available here.
Mathews, J. & Tan, H. (2015) China’s Renewable Energy Revolution. Building a Sustainable Political Economy – SPERI Research & Policy Series. Basingstoke: Palgrave Macmillan. DOI: 10.1057/ 9781137546258.
Notes
1 For example, see an article published in Reneweconomy.com.au based on a report from Deutsche Bank; and a report by Greenpeace East Asia.
2 Those official targets are stated in the Energy Development Action Plan (2014-2020), released by the State Council in November 2014 (in Chinese). The details of the Plan can be found in English in ‘China unveils energy strategy, targets for 2020’, China Daily, Nov 19 2014.
3 See our previous article on this topic in this Journal as well as our new book on China’s renewable energy revolution (Mathews and Tan 2015).
4 See the article ‘The Post-Steel Era of China’ published in Financial Times (Chinese Edition) by Hao Tan (in Chinese).
5 A preliminary revision of the GDP data indicates an increase of the Chinese GDP in 2013 by 3.4%; and it is suggested that the upward revision could even be higher if a more internationally acceptable standard is adopted for calculating the GDP. See a commentary on this matter.
7 See, for example, a recent study by Greenpeace.


