
Abstract: China operates the world’s largest electric power system, which over the course of the 21st century has been consistently greening at the margin, even as the whole energy system and the manufacturing system it powers remain largely black. In this article we update our argument to reveal how in terms of capacity, of electricity generated and of investment, China’s electrical system is continuously greening and within less than five years, would be expected to be more green than black in terms of generating capacity. We demonstrate how the sourcing of generating power from hydro, wind and sun is becoming ever more significant, outranking the contribution from nuclear.
Keywords: China; Renewable Electric Power; Nuclear Power; Greening of Electric Power; Electrification
China’s electric power system, now the largest in the world, continues to be a major source of strength for the country’s manufacturing system, also the world’s largest, but also a major source of carbon emissions. For the past several years we have documented the greening of China’s electric power system, focusing on the shift at the margin away from fossil fuels towards generation from water, wind and sun – from green, renewable sources. We have argued that China is doing this as a means of enhancing energy security, since the renewable sources are found within the country and the manufacture of the renewables devices is under national control. The positive impact on reducing carbon emissions is, from this perspective, a fortunate side effect.
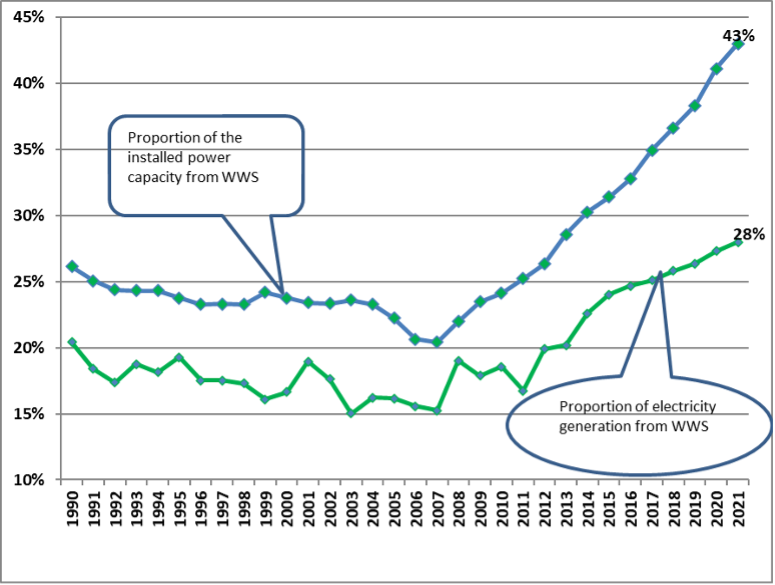
The data for 2021 are now available from the China Electricity Council (CEC) and National Bureau of Statistics (NBS); they reveal that for the 14th year in a row China has expanded its generation of electric power from water, wind and sun both in terms of capacity (exceeding 1 trillion watts for the first time) and in terms of actual power generated. The all-important proportion of electric power capacity sourced from water, wind and sun (WWS) reached 43% in 2021, rising steadily from 20% in 2007. This implies a proportionate increase of 23% over 14 years, or more than 1.5% increase in green generating capacity each year. If this continues at the same rate (and there seem to be no obvious barriers standing in the way) then China’s electric power system will be based on green sources (WWS) for 51% of its generating capacity by 2026, i.e. within less than five years. This would be a momentous achievement, meaning that China’s electric power system would have become more green than black (in terms of capacity) by that date.
In terms of actual electric energy generated, China’s total reached a new high of 8, 377 TWh in 2021, of which 5,646 TWh came from thermal (coal fired) power sources and 2,323 TWh came from WWS (green) sources. This represents ten years of steady expansion of the proportion of electricity produced from WWS sources, reaching 28% by 2021, up from 17% in 2011.
At the same time, China has increased the extent of its nuclear generating capacity and its production of nuclear generated electricity, raising capacity from 1% in 2010 to 2% in 2021, and actual electricity generated from 2% in 2010 to 5% in 2021. This too is a “greenish” energy strategy, and one where China is actually leading the world in terms of genuine innovation involving thorium fuelled reactors as well as fourth generation high-temperature modular pebble-bed reactors. Yet as we note below, China’s leading nuclear power company China General Nuclear Power Co., Ltd (CGN) by now operates more plants producing electric power from renewable sources (WWS) than from nuclear sources.
No other major industrial country can match this degree of greening over recent years or its degree of consistency. The Figure 1 reveals what has happened in terms of generating capacity and actual electricity generated, for comparison with earlier years as discussed in our earlier articles.

Figure 1. Greening of China’s Electric Power System, 1990 to 2021. Data source: Authors’ calculation based on CEC and NBS China.
Table 1 provides the full set of data, as supplied by CEC and NBS, covering the greening of China’s generating capacity, the shift towards green electricity in terms of power generated, and the levels of investment in the power generation system.
Table 1. China’s Electric Power Sector, 2010 to 2021
|
1A. Installed Capacity (GW) |
 |
|
1B. Power Generation (TWh) |
 |
|
1C. Annual Investment (CNY Billion) |
 |
Data Source: Authors’ calculation from CEC and NBS.
Note that in terms of investment in power generation plants, the 2021 result shows that investment in WWS sources of power generation rose to RMB 432 billion (US$ 65 billion at an exchange rate of 0.15), up from RMB 157 billion in 2017, and accounting for 78% of total investment in power generating plant. This again shows the strength of the Chinese drive to green its electric power system, with a level of investment that far exceeds that of other industrial countries.
At the same time, Table 1 reveals how China continues to be a largely black energy power, with coal-fired power generation remaining as the principal source of power in the country. By 2021 China’s coal-fired power capacity declined to 55% of total capacity, while electricity from coal generation fell to 67% of total electricity generated. The year 2021 saw a year-over-year increase in the annual investment in thermal coal plants for the first time in several years.
In Figure 2 we show China’s installed power generation capacity in 2021 compared with the situation in the year 2010, indicating what a substantial expansion in capacity there has been overall, and in terms of WWS sources, resulting from China’s greening policies.

Figure. 2. China’s Installed Power Capacity 2010 vs 2021. Data Source: Author’s calculation based on CEC and NBS.
In Fig. 3 we show results for actual power generated, revealing the steady rise of electric power generated from WWS sources, reaching 2,323 TWh by 2021, or 28% of total generation. Nevertheless Fig. 3 reveals that China’s electric power system is still largely black, with most power being generated from thermal (coal fired) sources. This means that China has become the world’s largest emitter of greenhouse gases, principally carbon dioxide. The electric power generation system is greening at the margins, but it is still a largely black system (as were the electric power systems of all major industrial powers).

Figure 3. Annual Power Generation in China, 1990 to 2021. Data sources: CEC, NBS, and World Bank.
Additional Generating Capacity Added Each Year
Looking more closely at the composition of the generating capacity added each year to China’s electric power system, we see from Fig. 4 that capacity added in 2021 was 179 GW, of which WWS sources accounted for 121 GW, or two thirds (68.3%). By contrast, thermal (coal fired) capacity added amounted only to 52 GW, (29%). In other words, green capacity added was more than double the black capacity added in 2021. This is why we can be confident in asserting that China’s greening of its electric power system can be expected to continue as a dominant trend – subject to the hurdles and problems we discuss below.

Figure 4. China’s Annual Capacity Additions, 1991–2021. Data source: UN and CEC.
Total Energy Consumption Comparisons
By way of international comparisons, Fig. 5 reveals the steady rise in proportion of total energy consumption sourced from WWS sources in all industrial regions of the earth. The chart reveals that the European Union (EU) countries have reached the highest level of total energy consumption sourced from WWS (18%) (given their long history of greening policies) while China is rising steadily, doubling from 7.5% in 2010 to reach 15% by 2021, with both the US and Japan reaching just 11%.

Figure 5. Share of WWS in Total Energy Consumption, 2010 to 2021, by Industrial Region. Source: Authors’ calculation based on BP Energy Review 2022.
The black counterpart to this picture of greening is shown in Fig. 6, which reveals the proportion of total energy consumption sourced from fossil fuels in international comparison. Here the EU can be seen to have reduced its dependence on fossil fuels (FFs) from 77% in 2010 down to 70% in 2021, as world leader, while China has steadily reduced its dependence on FFs from a high of 92% in 2010 down to 82% in 2021 – a better result than that achieved by Japan (85%) and catching up with the US (81%).

Figure 6. Share of Fossil Fuels in Total Energy Consumption, 2010 to 2021, by Industrial Region. Source: Authors’ calculation based on BP Energy Review 2022.
When looking more closely at China’s record of coal burning in electric power generation, we see that the pace of reduction has slackened in recent years, as coal burning has increased to keep pace with expanded energy generation and consumption. Fig. 7 reveals that thermal power generation exceeded 5000 TWh in 2021 for the first time, resulting in the burning of more than 2000 tonnes (2 Gt) of coal in power plants and more than 4.2 Gt coal in industry overall. These high levels of coal burning are the source of China’s high levels of carbon dioxide emissions with their global warming potential. This is another indication of how black the energy system in China remains, even as it greens at the margin.

Figure 7. Coal Power Generation and Consumption in China (1980–2021). Data Source: CEC, NBS and BP Energy Review.
Compared with the year 2020, China’s 2021 coal consumption increased overall by 4.6% reaching 4.2 billion tons (NBS, 2022 and CEEC, 2021). During the last decade, the share of coal in China’s total energy consumption has been decreasing from 71% in 2011 to 55% in 2022, which is still much higher than Japan’s 27% and US and the EU’s at 11%. In terms of the share of all fossil fuels (oil, gas and coal) in total energy consumption, China has 83% in 2021, second to Japan’s 85% and higher than US’s 81% and European Union’s 70%.
The 2021 power shortage has only reinforced China’s policy direction that burning fossil fuel is unsustainable. Economically, coal power generators faced continuing pressure to reduce their level of coal consumption. The government kept electricity prices low for social stability but the coal prices increased sharply from supply shortage. Coal power plants lost more than RMB 0.1 for every kWh of electricity they generated (or RMB 100 for every MWh of electricity generated) (BBC news, 2021; Xinhua Net, 2021).
In our view, China cannot resolve this dilemma by increasing coal production. In the past few years, the domestic coal supply reform and the latest carbon emissions target have resulted in continuously declining coal production capacity, and closing high-polluting and low-efficiency coal mines (Liu, G-R, 2021).
Power shortages experienced in 2021 resulted from the central government’s determination to implement its “Dual Control”, i.e. controls over energy intensity and total energy consumption. This policy has incorporated energy-saving indicators into the provincial governments’ KPIs since 2015 (Hu, X-H and Jiang H-Z, 2021).
In August 2021, the National Development and Reform Commission issued high-level warnings to the provinces of Jiangsu, Guangdong, Yunnan over their high levels of coal consumption. The provinces subsequently switched off or rationed power to catch up with their control targets (BBC news, 2021). All this reveals how China remains a black energy power even as it greens its electric power system at the margin.
China’s Nuclear Power Developments
Alongside rapid growth in renewable power sources (WWS) China is also expanding its nuclear power system – albeit at a much lower rate than for WWS. As seen in Table 1A above, China has raised its nuclear generating capacity to 53 GW by 2021, raising the proportion of generating capacity from just 1% in 2010 to 2% in 2021. In terms of electricity generated from nuclear sources (Table 1B), China raised the level to 408 TWh, raising the proportion of nuclear electricity from 2% in 2010 to 5% in 2021. Together, renewable (WWS) and nuclear sources are rising while fossil fuel sources are falling, in what appears to be an irreversible transition.
China’s nuclear dependence situates it as one of the world-leading nuclear power generators and consumers. According to the data of the World Nuclear Association (WNA), there were 437 nuclear power units in operation with a total installed capacity of 389 GW in the world as of December 31, 2021. (China National Nuclear Power Co., Ltd, 2022a). China’s installed capacity (53GW) accounted for 13.6% of the world’s tally.
The 2011 Fukushima nuclear accident was a watershed moment for China’s nuclear power development. Before it, China’s policy makers were convinced that the development of nuclear power could contribute to the realization of cleaner air and stable energy supply. “The Plan for the Medium and Long-Term Development of Nuclear Power (2005-2020)” set the target to expand the capacity from 7 GW in 2005 to 70 GW in 2020 (Hibbs, 2018). Fifteen inland areas were chosen as the sites for future nuclear power plants (Hibbs, 2018). The stakeholders estimated that China’s nuclear power capacity would reach between 400 GW and 500 GW by 2050 (Hibbs, 2018).
After the accident, China joined the other countries to take a cautious attitude towards nuclear power development. Five days after the accident, China’s State Council suspended approvals for new nuclear power projects and delayed the construction of some previously approved projects, emphasizing on absolute safety in nuclear power operation and construction (NEA, 2022). Accordingly, the 2020 target was reduced from 70 GW to 58 GW and the plan for inland nuclear power plants was suspended. By the end of 2021, the realized capacity was 53GW (Table 1).
The 14th Five Year Plan set a target of 70 GW for nuclear power installed capacity (NDRC, 2022b), a level missed in the 13th Five Year Plan period. According to Kang Junjie, Deputy Director of the Climate Change and Energy Transition Program at the Institute of Energy of Peking University, nuclear power plays a supplementary role in China’s energy system. Based on the list of approved projects, he estimated that by 2030 China’s total installed nuclear power capacity would be around 100 GW (China Power.com, 2022).
Commercial analysts like S&P Global continue to issue optimistic forecasts for nuclear power in China. In 2022 Platts issued the opinion that nuclear capacity would rise from a projected 70 GW in 2025 to 145 GW in 2035, or more than doubling (Yin, 2022). We remain unconvinced by such arbitrary projections.
Nuclear power safety was emphasized in the 14th Five Year Plan. The new plants were required to “implement the strictest safety standards and supervision, and always put safety first”(NDRC, 2022b). After the Fukushima nuclear accident, it has been difficult for the central government to obtain the consent of the local governments and public for new construction and storage sites. A survey by the Chinese Academy of Engineering in August 2017 stated that only 40% of the Chinese public support the development of nuclear power (Hibbs, 2018).
Besides the operational and political risks, the nuclear industry’s dependence on fuel import and its economic non-competitiveness as well limit its development. China still relies on foreign suppliers for all stages of the fuel cycle especially for uranium supply (World Nuclear Association, 2021). Since 2007, half of the country’s uranium consumption has been from overseas. The share of imports in the total consumption increased from 51% in 2007 to 87.5% in 2018 (see Fig 8). The annual payment for the imports has exceeded one billion USD since 2017 (see Table 2).

Figure 8: China’s Dependence on Imported Uranium. Source: Authors based on Leading Industry Research, 2018.
Table 2: China’s Payment for Uranium Imports (2017–2021)
|
Year |
2017 |
2018 |
2019 |
2020 |
2021 |
|
Imports (USD billion) |
1.47 |
1.48 |
1.31 |
1.5 |
1.2 |
Source: Authors’ calculation based on ARChina Research, 2022.
China’s natural uranium production accounts for only about 4% of the world’s total production of 47,677 tons in 2020 (ARChina Research, 2022). It is estimated that if China were to increase its nuclear generating capacity to 150 GW, then about 250,000 tons of uranium would need to be stockpiled to meet the fuel consumption (Hibbs, 2018). Whether a demand of this level can be met by the world’s production is open for debate.
In China, nuclear power enjoys the highest selling price among the power sources. In 2020, the nuclear power price remained as CNY 0.43 /kWh, a price set by the government since 2013, while the power prices from onshore wind and solar were CNY 0.34/kWh and CNY 0.41/KWh respectively (Energy World, 2020). The RE power costs are expected to drop further. Since 2021, China’s central government has no longer subsidized new solar and onshore wind power projects (NDRC, 2021). Their power prices are set based on the local benchmark price of coal-fired power generation (NDRC, 2021).
The high price for nuclear power has resulted mainly from the large capital expenditure involved in building nuclear power plants. According to China Electric Power Planning and Engineering Institute and China Renewable Energy Engineering Institute, the average engineering cost of nuclear projects (CNY/kW) was higher than for hydro, wind and solar by 28.7%, 58.7% and 62.5% respectively (People’s Daily, 2019).
Table 3: China’s Engineering Cost of Power Projects (2016–2017)
|
Power Project |
Nuclear |
Hydro |
Wind |
Solar |
Thermal |
|
Engineering Cost (CNY/kW) |
12,038 |
9,352 |
7,587 |
7,406 |
3,593 |
Source: Authors based on People’s Daily, 2019.
It is uncertain for how long the nuclear plants can continue enjoying the favoured selling price. The central government has expressed its determination in the 14th Five Year Plan to continue the market-oriented reform of electricity pricing for all energy sources (NDRC, 2022b). The nuclear industry is concerned by the prospect that they might not be able to compete with the WWS power generators without this policy support (Hibbs, 2018).
In fact, China’s nuclear power generators have been hedging their position by investing in WWS generation. China General Nuclear Power Co., Ltd (CGN), the country’s top nuclear generator, has been lowering the share of its nuclear generation in its power capacity from 71.7% in 2010 to just 46% in 2020. In the same period, the share of its wind and solar capacities increased from 19.5% in 2010 to 34.1% in 2020 (Wang, 2020). By 31 Dec 2021, CGN owned 28.2 GW installed nuclear capacity (accounting for 53% of the national capacity), and a total of 39 GW of wind and solar capacities (China General Nuclear Power Co., Ltd, 2021). In other words, the country’s top nuclear generator was relying more on solar and wind power by 2021 than on nuclear power.
China National Nuclear Power Co., Ltd (CNN), with 23.7 GW installed nuclear capacity and accounting for 42.52% of the national capacity, has installed 8.87 GW (2.63 GW wind and 6.23 GW solar) of renewable energy capacity by March 31, 2022. Another 2GW wind and solar is under construction (China National Nuclear Power Co., Ltd, 2022a).
CNN’s 2025 targets include a total installed capacity of 56 GW, including 26 GW of nuclear power and 30 GW of renewable energies, i.e., the company is planning to add 21.13 GW renewable energy capacity and 2.3 GW nuclear capacity during the period from 2022 to 2025 (China National Nuclear Power Co., Ltd, 2022b).
China’s Innovative Nuclear Strategies
While China is operating just over 50 conventional nuclear reactors (with combined capacity of 53 GW), where it simply follows Western and world practice in utilizing water-cooled, uranium-fed technology with all the well-known safety concerns, military applications and high costs (notably insurance costs) there are other, more reliable nuclear technologies which China is also aggressively pursuing. The US (and the West as a whole) abandoned the promising molten salt reactor (MSR) technology based on thorium rather than uranium and water, when the world’s only thorium reactor at the Oak Ridge National Laboratory was shuttered in 1969. Now China’s Shanghai Institute of Applied Physics (SINAP) is operating a new thorium reactor near Wuwei, in Gansu province, with an initial experimental goal of generating at 2 MW with a goal of operating a 373-MW thorium reactor by 2030. An article in Nature commended the SINAP project in 2021, stating cautiously that “If China’s experimental reactor is a success, it could lead to commercialization and help the nation meet its climate goals” (Mallapaty, 2021).
China’s Per Capita Energy Consumption and Associated Trends
China’s per capita energy consumption was lower than the world’s level until the year 2009. After that, this ratio increased from 21.2 MWh in 2010 to 30.3 MWh in 2021 at a CAGR (Compound annual growth rate) of 3.3%. China’s per capita energy consumption is now well above the world level (20 MWh) and now exceeds that of the UK, and is fast catching up with that of Japan (Fig. 9), while remaining between one quarter and one half of the United Kingdom, Japan and the United States.

Figure 9. China’s Per Capita Energy Consumption, 2006 to 2021. Data: Authors’ calculation based on ourworldindata.org
China’s rapidly rising per capita energy consumption is a reflection of its intensive industrialization. China has a large manufacturing industry, with high levels of fossil fuel demand. According to the CIA data (CIA, 2022), in 2017, China’s industry sector contributed 40.5% to its total GDP. The same ratio for other leading industrial countries were 30.1% for Japan, 20.2% for the UK and 19.1% for the US. In 2020, China produced more than half of the world’s most energy-consuming products such as crude steel (56.7%), electrolytic aluminum (57.3%), rare earths (58.3%), tungsten (82.1%), and cement (60%)(Wang, 2022). In 2021, China’s secondary sector (industry and construction) consumed 68% of the nation’s power (Liu, 2022).
The 14th Five-Year Plan
China has followed a planned and rational programme of switching from fossil fuels to clean, renewable energy through its sequence of Five-Year Plans. The latest such plan, the 14th FYP, covers the years 2021 to 2025. Like its previous plans, the 14th FYP has a central goal to reduce energy intensity of GDP, in this instance down to 13.5%. To achieve this result, China will need to support an annual growth rate of 5% in GDP with only a 2% annual growth rate in energy consumption.
The 14th FYP aims to reduce China’s energy intensity by 13.5%, i.e. from 0.147 in 2020 to 0.127 by 2025. The measures will focus on substituting fossil fuel consumption by renewable energy, implementing energy-saving renovations in energy intensive industries, and improving the electrification level. During the period from 1990 to 2020, for every 1% increase in its electrification level, China’s energy intensity decreased by about 2.8% (People’s Daily, 2021).
The principal means through which the Chinese leadership intends to achieve this improvement is through raising the level of electrification of China’s industry, transport and domestic sectors. The target is to accelerate the expansion of renewable energy in its power generation, expedite energy electrification, push the transformation and upgrading of the high-energy-consuming industries such as iron and steel, nonferrous metals, construction materials, and chemicals (Li, M-J, 2022). The aim, as spelt out in the 14th FYP, is that the share of electricity in total energy consumption should rise from a projected 35% in 2025 to a projected 90% in 2060 (Fig. 10). If this long-term electrification goal is met, it is likely that China will be the most electrified of the major industrial powers. This ultra-electrification strategy provides the foundation for China’s continued greening.

Figure 10. China’s Accelerating Electrification, 2025 to 2060 (Projected). Source: Authors, adapted from Yin Z-S, Huang S-B and He L, 2022, found here.
The 14th FYP reaffirms China’s commitment to long-term intensification of its switch to renewable energy and the shift away from fossil fuels. This has been emphasized in both the document itself and in subsequent events such as the Central Economic Work Conference staged at the end of 2021, where renewed emphasis was placed on renewable energy substitution. The Government Work Report 2022 reiterated the importance of constructing large-scale wind and solar farms and improving the grid’s ability to absorb renewable energy (Huang, D-Z, 2022).
The 14 th FYP has also projected the acceleration of the substitution of fossil fuels by renewable energy. According to the plan, China’s renewable energy development will be characterised by four features: large-scale installation; rapid increase in clean power consumption; more market-oriented expansion (less subsidies), and high stability and reliability.
RE development in the 14th FYP calls for a focus on building up wind and solar generation capacity as well as promotion of downstream industries like green hydrogen. In Table 4 we discuss these targets, drawing on the Chinese literature and making the projections published therein available to the English-speaking world for the first time.
Table 4. Targets of Renewable Energy Development in the 14th Five-Year Plan (2021–2026)
|
RE DEVELOPMENT |
TARGET |
|
Renewable Generation in 2025 |
Double the level of 2020 (up to 4000 TWh from 2000 TWh) |
|
RE proportion in the increase of energy consumption from 2021 to 2025 |
To exceed 50% (already at 50% in 2021) |
|
Total RE energy consumption in 2025 |
To exceed 1 billion tonnes coal equivalent (8,130 TWh, based on 1kWh = 0.123 Kg coal equivalent) |
|
RE proportion in total energy consumption in 2025 |
33% |
|
The proportion of wind and solar power in total energy consumption in 2025 |
To exceed 18% |
|
Cumulative installed capacity for solar and onshore wind farms in 2025 |
To exceed 744 GW, amongst which 665GW in nine major clean energy bases, including the lower reaches of the Jinsha River, the Yalong River basin, the upper reaches of the Jinsha River, the upper reaches of the Yellow River and Jiziwan, Hexi Corridor, Xinjiang, northern Hebei and Songliao |
|
Cumulative installed capacity for offshore wind farms in 2025 |
To exceed 79 GW in 5 offshore wind power bases in Shandong Peninsula, Yangtze River Delta, Southern Fujian, Eastern Guangdong and Beibu Gulf. |
|
Green hydrogen production |
Construct large scale demonstration projects in areas where RE power is cheap and suitable for the development of hydrogen storage and transmission; Build a large green hydrogen production base; Replace FF with green hydrogen in chemical industry, coal mining, and transportation. |
Source: Authors based on NDRC, 2022a and Yin Z-S, Huang S-B and He L, 2022.
The targets outlined in the 14th FYP are aligned with China’s announcement that its planned installed capacity of wind and solar power will exceed 1,200 GW (1.2 TW) by 2030 to achieve the carbon neutral target to peak CO2 emissions before 2030. Note that installed capacity of generating equipment utilizing WWS sources reached 1 TW for the first time in 2021.
Based on the construction plans of the major power generators and the provinces’ 14 th Five-Year Plans, the target of 1,200 GW is a plausible target for 2030. By now, the installation plans released by 14 state-owned power generators have amounted to over 623 GW (Shui, Q-M, 2022). A total of 24 provinces planned to add 649 GW, which would represent a growth rate of 143% during the 14 th FYP period (Zhongtai Securities, 2022).
Nevertheless just as in our discussion of China’s nuclear power prospects, where physical limits to uranium supplies loom large, so in the case of future renewable energy targets (for solar, wind, battery supplies) there are physical constraints that must be addressed if China’s ambitious targets are to be realized. We acknowledge that the IEA, World Bank and other bodies point to critical mineral and other complications that need to be addressed if these targets are to be met. We point to the recent work of Luo et al (2022) who argue that “China’s future supply of mineral resources would severely constrain clean energy development due to the close relationship between mineral resources and clean energy technologies”.
Results to Date
By the end of 2021, the first year of the Five-Year plan period, 41% of the solar and onshore wind target (304 GW) had been installed in the nine clean energy bases and 33% of the offshore wind target (26 GW) had been installed in the five offshore wind power bases (Yin Z-S, Huang S-B and He L, 2022). These results indicate how rapidly China is moving toward its clean energy targets.
Even more recently, in the first half of the year 2022, the CEC reports that total installed capacity reached 2.4 TW in China’s electric power sector, of which thermal capacity reached 1305 GW while WWS capacity reached 1079 GW, and nuclear capacity reached 56 GW (CEC 2022). This represents a continuation of the trends we have identified in this article, with WWS sources rising to reach 44.2% of total installed capacity, thermal sources falling to 53.5% capacity, and nuclear accounting for 2.3% of generating capacity. If we look at newly installed capacity for the first half of 2022, CEC reports that 69.1 GW of new capacity was added overall, of which WWS accounted for 53.3 GW of new capacity, thermal sources accounted for 13.2 GW, and nuclear for 2.3 GW – so that WWS sources accounted for no less than 77% of newly installed capacity, and thermal sources for just 19% of newly installed capacity (Fig. 11)

Figure 11. Newly Installed Generating Capacity in China, 1H 2022. Data Source: authors’ calculation based on CEC report.
Transmission
China’s greening of its electric power system is not confined to investing in WWS sources for power generation. It also encompasses investing in upgrades of the grid’s transmission system, utilizing China’s own Ultra High Voltage (UHV) technology which enables the grid to carry high levels of renewable power across vast distances. UHV will remain the focus of grid investment in the 14 th FYP, indicating that the grid technology is here to stay in China. The investment in UHV projects is proposed to reach RMB 450 billion (equivalent to USD 67.5 billion at an exchange rate of 0.15), a 30% increase from the RMB 346.2 billion (USD 51.9 billion) in the “13th Five-Year Plan” period. There are 12 UHV channels planned with a distribution capacity of 120 GW of WWS power (Yin Z-S, Huang S-B and He L, 2022).
In 2022, State Grid refreshed its plans to construct 13 UHV lines (10 AC and 3 DC). The construction of six lines had been started by April 2022 (CEC, 2022a). It is worth noting that China stands alone amongst leading industrial powers in its drive to upgrade the grid with UHV technology, providing an insight into the degree to which its greening strategies are now based on innovation rather than imitation.
Future Prospects for the Greening of China’s Electric Power System
Based on the results reported so far, as outlined in this article, we are confident that China will continue to green its electric power system, accelerating the switch-over from fossil fuels (mainly coal) to renewable energy sources based on water, wind and sun (WWS). We see this as a smart move for China as it increases the level of electrification of its economy and reduces its dependence on burning of fossil fuels for its energy supplies. The process of reducing dependence on coal involves a major economic and social revolution as established companies and communities based on coal are forced to switch over to renewables, something that cannot be pushed too hard or too fast. But the more that China drives its greening of electric power the greater its protection of energy security, promising to leave the “Wild West” era of fossil fuel dependence behind it. China is increasing its energy security as it raises the level of dependence on manufactured energy devices – devices based on renewable energy and devices based on nuclear power – both based on manufacturing (under national control) rather than on mineral extraction. Yes, we acknowledge that there are physical resource constraints that stand in the way of achieving these targets, but we expect that China’s energy policies will address these constraints and the shift to a circular economy will eventually provide much of the resources required through recycling rather than through virgin mining. We see this as the essence of China’s modernization strategy, which promises to be based on clean and green energy and which can be expected to continue to fall in cost as a result of the technology learning curve.
Of course China’s greening of its electric power system needs to be seen in its geopolitical setting, where competition with the United States over technological leadership looms large, and the role of fossil fuels has been cast in sharp relief by the Russo-Ukraine war. No doubt China has been reaping some short-term advantages in its purchase of oil and gas supplies from Russia, but this is not to obscure the overall strategic direction outlined by China’s clean and green energy policies. In this article we have sought to highlight the strategic direction of China’s shift to renewable sources, while acknowledging the difficulties to be encountered in resources supply which will call for detailed and targeted policies if they are to be circumvented.
References
ARChina Research (前瞻产业研究院), 2022. Analysis of the supply and demand trend of China’s radioactive hazardous chemicals market in 2022: demand will continue to increase (2022年中国放射性危化品市场供需现状及发展趋势分析 放射性危化品需求将持续增加). Available here.
BBC News, 2021. Three reasons for China’s daily life impacting power outages (中国拉闸限电冲击居民生活 背后三个原因). Available here.
Beijixing Storage Net, 2022. 39.7GW in 12 provinces and cities! The “14th Five-Year” energy storage planning target disclosed (12省市39.7GW!“十四五”储能规划目标来了). Available here.
CCTV Net, 2021. Why power switched off? Experts explain key issues (为何“拉闸限电”?专家解读几大焦点问题). Available here.
CEC, 2022a. Operation overview of the power industry (January to May 2022) (2022年1-5月份电力工业运行简况). Available here.
CEC, 2022b. Operation overview of the power industry (January to June 2022) (2022年1-6月份电力工业运行简况). Available here.
China Energy Engineering Group Co., Ltd (CEEC), 2021. China Energy Development Report 2020: 4.04 billion tons consumed in 2020 with the proportion of coal power dropping below 50% of the total installed capacity (《中国能源发展报告2020》:2020年我国煤炭消费40.4亿吨 煤电装机比重已降至50%以下). Available here.
China General Nuclear Power Co., Ltd, 2021a. 2021 Environmental, Social and Governance Report of China General Nuclear Power Co., Ltd. Available here.
China General Nuclear Power Co., Ltd, 2021b. The Summary of the 2021 Annual Report of China General Nuclear Power Co., Ltd (中国广核电力股份有限公司 2021 年年度报告摘要). Available here.
China National Nuclear Power Co., Ltd, 2022a. Summary of the 2021 Annual Report of China Nuclear Power Corporation Limited (中国核能电力股份有限公司2021 年年度报告摘要). Available here.
China National Nuclear Power Co., Ltd, 2022b. The Corporate Social Responsibility Report 2021 of China Nuclear Power Corporation Limited (2021年中国核能电力股份有限公司社会责任报告). Available here.
China Power.com, 2022. The reform on nuclear power electricity price looming (核电上网电价改革来了). Available here.
CIA, 2022. GDP – composition, by sector of origin. Available here.
Energy World, 2020. List of electricity prices in China (中国电价一览表). Accessed on 18 August 2022, here.
Hibbs, Mark. 2018. The future of Nuclear Power in China. Carnegie Endowment for International Peace. Available here.
Hu, X-H and Jiang H-Z. 2021. Seven key issues on power outage (“拉闸限电”七大焦点解读). Available here.
Huang, D-Z. 2022. From “dual control over energy consumption” to “dual control of carbon emission”: has the wind direction of new energy changed? (从“能耗双控”转向“碳排放双控”,新能源的风向变了吗?). Available here.
Leading Industry Research (立鼎产业研究网), 2018. Statistics on China’s uranium production, demand, import and external dependence (2007 to 2018) (2007-2018年我国铀矿产量、需求量、进口量及对外依存度统计). Available here.
Li, M-J. 2022. Technology upgrade under “Dual Control over Energy Consumption” (“能耗双控”背后的技术升级). Available here.
Liu, B-J. 2022. Understand China’s energy in 2021 through 9 pieces of information(9个数据看懂2021中国能源). Available here.
Liu, G-R, 2021. Power rationing did more harm than benefits in long run, and returning to market is the best way to energy-saving and emission reduction (拉闸限电长期弊大于利,回归市场才是节能减排的最佳出路). Available here.
Luo, X.Y., Pan, L.Y. and Yang, J. 2022, Mineral resource constraints for China’s clean energy development under carbon peaking and carbon neutrality targets: Quantitative evaluation and scenario analysis, Energies, 15 (19): 7029.
Mallapaty, S. 2021. China prepares to test thorium-fuelled nuclear reactor, Nature, Vol 597, 16 Sep 2021, pp. 311-312.
NBS, 2022. Statistical Communiqué of the People’s Republic of China on National Economic and Social Development in 2021(中华人民共和国2021年国民经济和社会发展统计公报). Available here.
NEA, 2022. It’s time to store energy for nuclear power (核电“蓄能”正当时). Available here.
NDRC, 2021. Notice of the National Development and Reform Commission on 2021 New Energy Power Pricing Policy (国家发展改革委关于2021年新能源上网电价政策有关事项的通知). Available here.
NDRC, 2022a. Renewable Energy Development Plan in the “14th Five-Year ” (“十四五”可再生能源发展规划). Available here.
NDRC, 2022b. The Plan for the Energy System in “the 14th Five-Year” (“十四五”现代能源体系规划). Available here.
People’s Daily, 2019. With power price much higher than that of hydropower, coal, Solar, and wind, the economics of nuclear power under test” (电价远高于水电、煤电、光伏、风电,核电经济性遇“大考”). Available here.
People’s Daily, 2021. In the 14th Five-Year, China’s energy intensity will be reduced by 13.5% to accelerate the formation of an energy-saving nation (“十四五”我国单位GDP能耗降低13.5%——加快形成能源节约型社会). Available here.
Shui, Q-M. 2022. Targeting 623GW! The “14th Five-Year” new energy plan of 14 state-owned enterprises and the achievement of the first year (目标623GW!14家央企“十四五”新能源规划及首年“成绩单”). Available here.
Wang, L. 2020. Power Sources of 5 Big and 4 Small Energy Companies (2010 – 2020) (“五大四小”十年电力版图). Available here.
Wang, Q. 2022. “Energy Data 2021(2021能源数据)”. Available here.
World Nuclear Association, 2021. China’s Nuclear Fuel Cycle. Available here.
Xinhua Net, 2021. Why power switched off or rationed? Can subsequent power supply be guaranteed? (多地为何“拉闸限电”?后续电力供应能否保障?). Available here.
Yin, I. 2022. Fewer hurdles for nuclear power growth in China compared to Asian peers: Ratings. S&P Global Commodity Insights. Available here.
Yin Z-S, Huang S-B and He L. 2022. New Energy Bases Accelerate UHV Construction: a special report on UHV of power equipment industry: (电力设备行业特高压专题报告:新能源大基地加速特高压建设), Everbright Securities. Available here.
Zhongtai Securities, 2022. Wind and solar in “14th Five-Year Plan”: 24 provinces plan to add 649GW of installed capacity (“十四五”风电、光伏规划梳理:24 省规划新增装机 649GW). Available here.