Abstract: There is widespread concern over the scale of China’s consumption of fossil fuels, and particularly over recent increases in coal burning in the electric power sector. Nevertheless it is a fact that China is greening its power sector more than blackening it. We present updated evidence that China’s electric power system has been greening – in terms of capacity added from renewable (WWS) sources, growth in electricity generated from WWS sources, and investment in new generation infrastructure. We present the results for the green renewable sector (WWS), the black fossil fuel sector (thermal) and the nuclear sector (growing, but not nearly as fast as WWS). This evidence reveals that China’s extreme dependence on coal and other fossil fuels is moderating, as it ramps up alternatives – particularly the generation of domestic power from renewable sources based on water, wind and sun (WWS). In short, China’s energy system is diversifying: it is greening within a large and growing carbon-intensive existing system. At the same time, China has steadily increased levels of coal burning in the past two to three years – even while the green trend in domestic power generation has continued. China’s level of fossil fuel investments abroad (particularly through the Belt and Road Initiative) remain a source of concern. China continues to send disconcertingly mixed messages on the energy front.
Intro
2020 has not been a good year for China – what with ructions over the origins and handling of the Covid-19 pandemic, continued unrest in Hong Kong, worsening of trade, technology, territorial claims, and human rights disputes with the US and with neighbors in the South China Sea and beyond, and a deadly border spat with India in the Himalayas. While China’s more aggressive stance in international fora has been widely noted, there has been less attention paid to the continuation of greening trends in its energy choices. In this article we return to these issues and update earlier contributions.1 In terms of energy strategy, China continues to operate the world’s largest fossil fuelled economy, albeit one with greening shoots within. China remains the biggest coal-burning economy on the planet, the largest importer of oil and natural gas, and the largest emitter of carbon dioxide, (the principal greenhouse gas). Nevertheless it displays strong greening trends that deserve to be noted by the international community.
The headline result in China’s recent energy choices is the reversal of previous phasing out of coal as fuel for power generation – a topic we shall comment on in a moment. But we wish to point to the trend that sees the greening of power sources continuing to counter-balance this reversal. The China Electricity Council (CEC) reports that in 2019 China’s additional power capacity from renewable water, wind and sun (WWS) sources amounted to 59.9 GW(water 3.8 GW, wind 25.8 GW and sun 30.3 GW), compared with just 50.6 GW additional capacity for all non-renewable sources – black sources as in coal and gas burning amounting to 46.5 GW, and nuclear sources to 4.1 GW. Of power capacity added in 2019, 54% was thus sourced from renewable sources (water, wind and sun) and just 46% from fossil fuels and nuclear sources together. (We shall explain below why we lump fossil fuels and nuclear together as distinct from clean, green and mass-producible WWS sources.)
So at the leading edge, where new electric generating capacity is being added, China’s electric power system recorded another year where green additional growth outranked black and nuclear, by 54% to 46% — even with an increase in the absolute amount of coal burned. Indeed, over the past decade, China’s green electric power capacity has increased from 24% sourced to WWS to 38% WWS – a green shift of 14% in a decade, a remarkable result for such an enormous system. If this rate were to continue, the Chinese electric power system would be more green (WWS) than black or nuclear before 2030. It is a powerful trend that has been able to overcome what we believe to be temporary blips where the decline in coal burning has been reversed. Pursuit of this trend over the past decade means that China is now the world’s undisputed renewables superpower – as shown dramatically in the international comparisons of investment in renewables capacity provided in Figure 2.
A second indicator of greening is power actually generated. In terms of electricity generation, power generated from WWS sources grew to 1,931 TWh in 2019, up 8.8% on the result for 2018 (1, 775 TWh). This increase in green power generation outranked the increase in coal burnt in power stations in that year. A third indicator of greening trends outweighing blackening trends and trends towards nuclear is that investment in China’s electric power system sourced from WWS reached RMB 198.5 billion in 2019, as compared with RMB 96.5 billion for thermal and nuclear sources – another indication of a powerful greening trend.
These three trends are worthy of international acknowledgment – alongside the reporting of black energy tendencies. As in the past, we report on the greening of China’s electric power system using the latest data from CEC and the National Energy Administration (NEA) on electric power capacity (Table 1 and Fig. 1) and electricity generation (Table 2 and Fig. 3). We then provide our principal chart, Figure 4, which shows the steady increase in electric power sourced from WWS in terms of capacity (reaching 38%) and in terms of electricity generated (reaching 26%) by 2019. We discuss the trends in increasing reliance on both WWS sources and nuclear sources for electric power (Fig. 5). We contrast the Chinese results with those of the US over the same decade (Figs. 6) for production and Fig. 7 for consumption trends). We then discuss the policy settings that have generated these Chinese results – bearing in mind that the Chinese electric power system is now twice as large as the US, and by far the largest in the world.
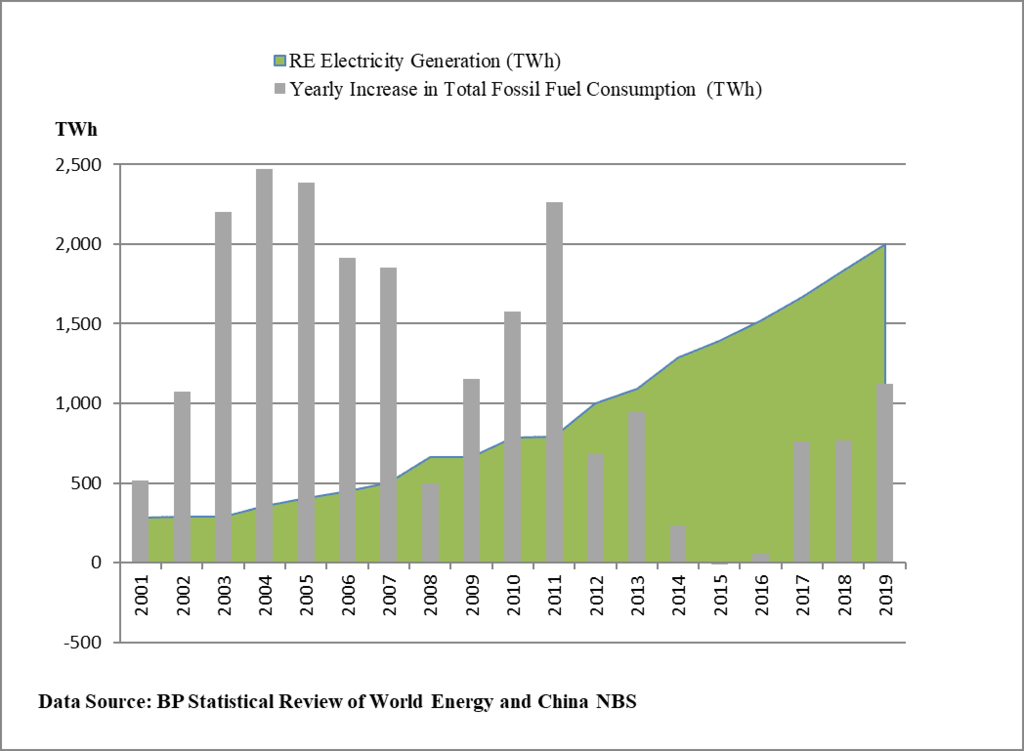
Finally, we examine China’s energy system overall – spanning all sectors encompassing power generation, transport, industry and agriculture. Here we update previous work to demonstrate that China’s additional total fossil fuel consumption recorded in 2019, across the entire economy, measured not in terms of coal-equivalent or oil-equivalent but in equivalent electrical units, stands at 1,123 TWh. This is more than counter-balanced by China’s green electricity generation for that year, which stood at 2,002 TWh, in 2019 (Figure 8).2 This is a precise result which we update in the present article to the year 2019. It means that China’s extra consumption of fossil fuels across the entire economy is more than counter-balanced by the domestic generation of green electricity from WWS sources in the same year – a pattern now repeated over many years.3 This may be interpreted as a continuation of a powerful greening tendency across the economy as a whole.
Yet China’s energy strategies continue to send mixed messages. While the greening trends are strong, the decisions to increase coal consumption and to make investments in coal burning facilities around the world carry a very different message. The best that we can do is monitor and report on this mixed messaging.4
Electric power capacity
As shown in Table 1, China’s total power capacity in 2019 reached 2,011 GW (or 2.0 TW), growing by 6% over the capacity reached in 2018. In 2019 thermal capacity (from burning fossil fuels) reached 1,191 GW, while green capacity sourced from WWS reached 771 GW.5 The increase in capacity from WWS sources (amounting to 60 GW) surpassed the increase in thermal capacity (at 47 GW) plus 4 GW for nuclear, (making 51 GW for non-WWS sources) for yet another year in 2019. This is the leading edge, where the overall system is changing due to addition of new capacity. Our results reveal that China added new capacity from fossil and nuclear sources amounting to 46% as compared with new capacity from renewable WWS sources of 54%. This additional green capacity was sufficiently large that it counteracted the effect of China burning more coal for power generation in 2019 than for 2018. It has to be said that the electric power system as a whole is still strongly black – 1,191 GW thermal as compared with 771 GW for WWS, or about 60% fossil fuels plus nuclear compared to 40% green for the electric power system as a whole. At the same time, we note that China’s green capacity of 771 GW is by far the largest on the planet, making China both the world’s leading producer of greenhouse gases and the global renewables superpower (as discussed below).
|
Table 1 Installed Power Generation Capacity (GW) of China ( 2010-2019) |
|
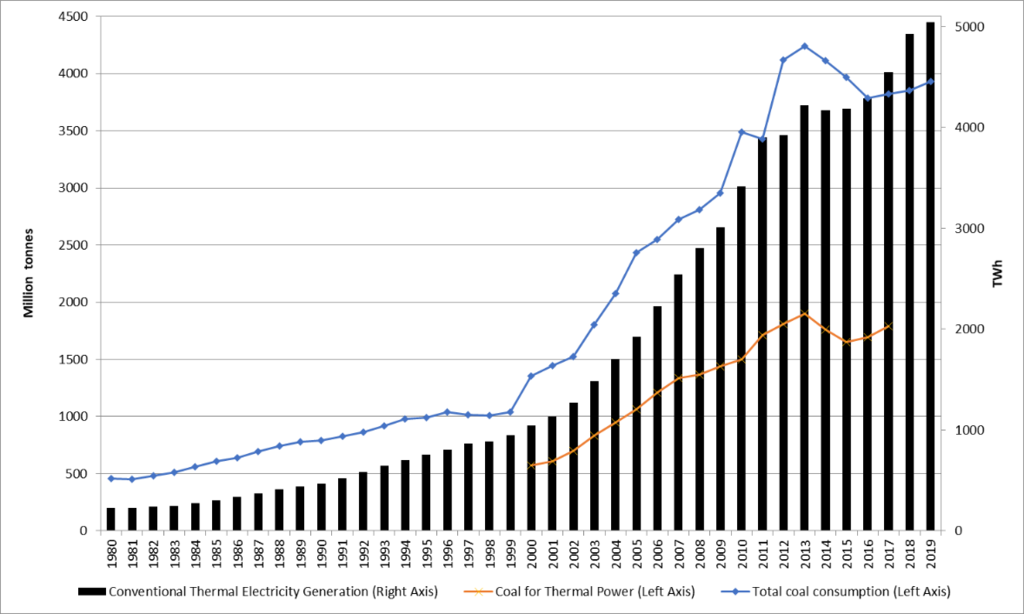
Fig. 1: Coal Consumption and Coal for Power in China Source: Authors, based on CEC data |
China’s coal consumption was rising, to reach a peak of 4,244 million tonnes (giga-tonnes) in 2013 (4.2 Gt), then falling before resuming an upward climb again in 2017. During the three-year period from 2017 to 2019, China’s annual coal consumption rose to 3,935 Gt after the low point reached in 2016 at 3,784 Gt — but it was still under the peak 2013 level of just over 4,000 Gt . Thermal capacity rose to just over 1000 GW in 2017, rising to 1,144 GW in 2018 and 1,191 GW in 2019 – but a six-ministry policy document from the National Development and Reform Commission (ND&RC) issued in June 2020 sets a limit of 1,100 GW on thermal capacity for 2020 (see discussion below on policy issues). Note that coal-fired electricity generation rose to just over 5000 TWh in 2019 – but the proportion of green power sourced from WWS has continued to rise because the electricity generated from WWS sources increased more rapidly. China is clearly exiting from coal as its principal power source – but in fits and starts.
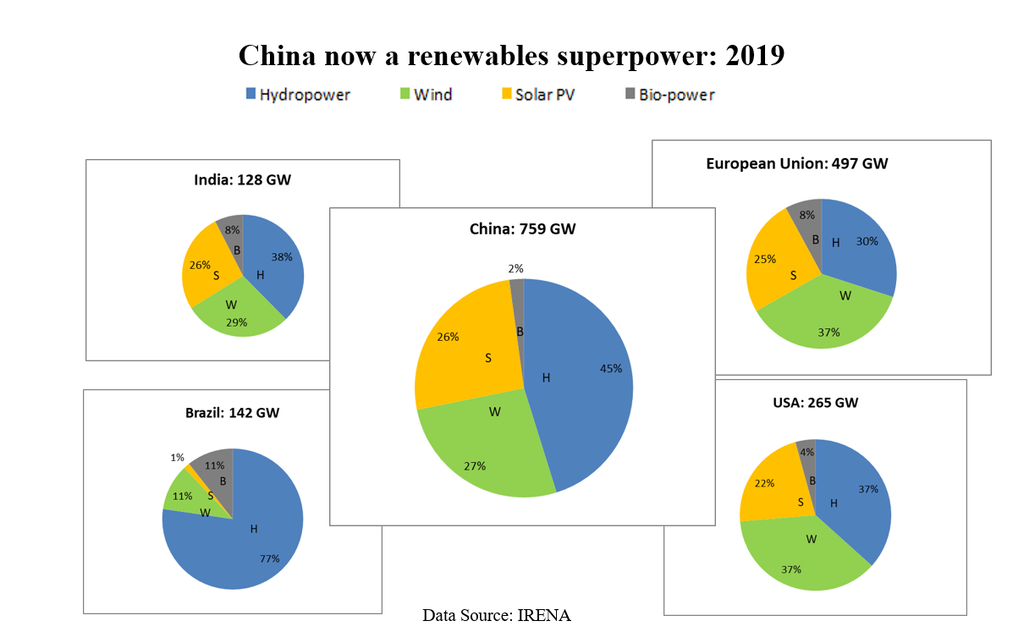
International comparisons provide another measure of China’s lead in this greening of generating capacity. The data for 2019, sourced from the International Renewable Energy Agency (IRENA), reveal how far China’s investment in renewables capacity exceeds that of other countries. The data indicate that China installed WWS capacity of 759 GW in 2019, compared with the EU in second place at 497 GW and the US at 265 GW, followed by Brazil at 142 GW, with India recording 128 GW.6 The comparison is shown in Figure 2.
|
Figure 2. International electric generating capacity, by major countries, 2019 Yet at home, China’s coal consumption remains a source of major concern and bafflement for observers – as discussed below. |
Electricity generated
As shown in Table 2 below, China generated 7,325 TWh of electricity in 2019, an increase of 4.7% over the total for 2018. Of this total, 5,394 TWh continued to come from thermal and nuclear sources, as compared with 1,931 TWh from WWS sources – 1,302 from hydro, 406 from wind and 224 from the sun (solar PV). The result is that China’s green electricity generated in 2019 amounted to 26% of the total – an increase of nine percentage points over the decade, from 17% in 2010 to 26% in 2019. This is again a remarkable green shift over the course of a decade for such a huge system.
The greening trend in this case is exhibited by the growth in green power generated from WWS sources, growing exponentially by between 9% and 10% per annum over the past three years (and by 26.2% over the decade), exceeding by a wide margin the growth of the energy system as a whole – as shown in Table 2 and Fig. 3. (We compare with nuclear growth rates below.)
|
Table 2 Power Generation of China (TWh), 2010-2019) Source: CEC |
The extra power generated in 2019 (over and above levels for 2018) amounted to 331 TWh overall, with 156.6 TWh additional power coming from green WWS sources, and just 120 TWh additional power coming from thermal sources. This means that of the extra power generated in 2019 over 2018 levels, 47.3% of the extra power came from WWS green sources compared with 36.2% from thermal sources (and 16.2% from nuclear).
Let us clear up a discrepancy: According to the newly published BP Statistical Review of World Energy, China’s total renewable generation reached 2,002 TWh in 2019 – as compared with our figure for 2019 of 1,931 TWh. The reason for the discrepancy is that we are focusing on just WWS sources, and neglecting others such as geothermal and biomass. Figure 3 presents China’s power generation from renewable sources (WWS) during the 14-year period from 2005 to 2019.
|
Fig. 3. China: Generation from renewables, 2005 to 2019 |
Investment in new generation capacity
The third trend which shows a clear greening tendency is investment in China’s electric power system. In 2019, a total of RMB 313.9 billion (US$ 44.3 billion) was invested in China’s power generation plants. Of this total, 69.3% was for generation from WWS sources, and less than 30% in thermal and nuclear sources. The investments in thermal and nuclear plants both decreased from 2018, by 20% and 25% respectively. The grid construction and upgrading continued in China, with the investment completed amounting to RMB 485.6 billion.7 This is evidence that China’s electric power investments are going to boost the green power system more than the power system based on nuclear sources and “black” fossil fuels.
|
Table 3: China’s Investment in Electricity (RMB billion) Source: CEC |
The trend line for electric power sourced from water, wind and sun (WWS)
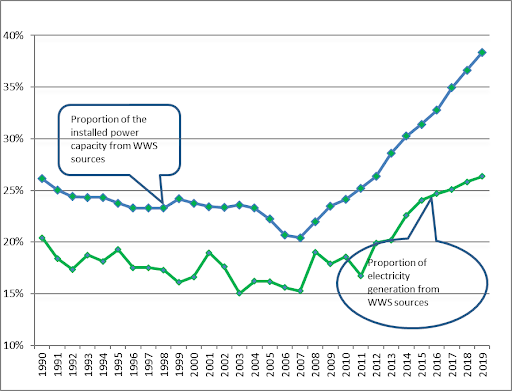
As in previous commentaries, we provide as our central finding that in China the proportion of generating capacity and of electricity generated sourced from WWS has been rising relentlessly for the past decade and more. This trend has been consistently rising since 2006/2007, as is clearly evident when plotted in Figure 4. We provide this as evidence that the greening tendency is stronger than the recent reversals in decline of coal burning in the power sector.
|
Fig. 4. The greening of China’s electric power system Source: Authors, based on data from CEC |
This chart, which we have been updating over several years, is the clearest indication of the greening of China’s electric power system – albeit one contained within a very large fossil-burning system where the absolute levels of coal burning have actually increased in the past three years. The chart reveals that there has been a green shift in China’s electric generating capacity over a decade, from 24% in 2010 to 38% in 2019 – or a green shift in the form of a 14% increase in WWS sources in the decade. This is a very large shift for such a huge system. If the trend continues (and with cost reductions in WWS sources it has every likelihood of doing so) then the proportion of power capacity sourced from WWS would be expected to reach 50% by 2030 or earlier – a tipping point which we would suggest has great significance.
The chart also reproduces the rise in proportion of power generated from WWS sources, rising from 17% in 2010 to 26% in 2019 – or a 9% green shift in electricity generated in the decade. (The green shift is not so forcefully evident in the electricity generation figures because of the varying electric generating capacity across wind, solar and hydro generation – as discussed above.) This rising level of green electricity from WWS sources can be expected to feed into other industrial, transport, commercial and domestic sectors, raising the green levels in the economy as a whole.
How rapidly has China’s share of global renewable power grown over the past two decades? To answer this question, we calculated China’s WWS global shares in terms of energy consumption, electricity generation and cumulative installed capacity. The synchronization of the expansions is clear, as shown in Table 4.
Table 4. China’s share of global renewable energy sourced from WWS (water, wind and sun) (Percent)
|
Year |
2000 |
2010 |
2019 |
|
Consumption |
7.7% |
17.8% |
26.9% |
|
Generation |
7.9% |
18.7% |
28.5% |
|
Cumulative Installed Capacity |
9.6% |
20.0% |
30.5% |
Source: Authors, based on data from BP Statistical Review of World Energy and Hydropower.org
In round terms, we can say that China accounted for 10% of global renewable energy production (from WWS) in 2000; for 20% in 2010; and for 30% in 2019.
Nuclear vs WWS sources
We noted above that China is increasing its reliance on nuclear sources for electric power capacity and electricity generation, alongside the increases in WWS sources. The question needs to be asked: could nuclear prove to be more significant in China as a source of low-carbon emissions than WWS sources? The data actually give a clear answer to this question.
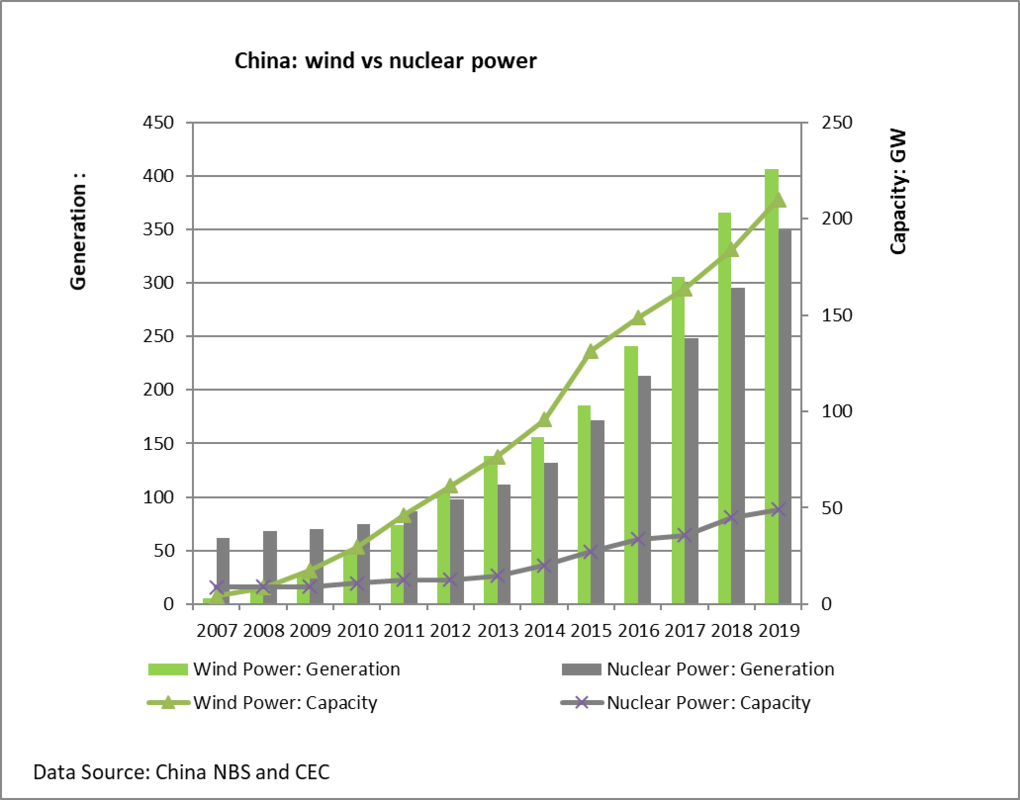
Consider Figure 5, which shows the increases in generating capacity as well as electricity generated, from nuclear power and from wind. The trend (up to 2019) is very clear.
|
Figure 5. China: Wind vs nuclear power |
Fig. 5 reveals that nuclear generating capacity has risen from around 20 GW in 2008 to around 49 GW a decade later, in 2019. Whereas capacity sourced from wind power increased from the same level as nuclear in 2008 to nearly 210 GW in 2019 – or more than four times the level of nuclear capacity. This trend can only be expected to continue, given the falling costs of wind power as opposed to rising costs for nuclear. Even though nuclear power has a higher capacity factor than wind, the amount of electricity generated by nuclear sources had reached just 349 TWh in 2019, compared with more than 406 TWh for wind. So over the past decade nuclear power generation rose 4.6-fold, while wind power generation rose more than 8-fold. Both sources have been increasing, with wind exceeding the growth of nuclear nearly twofold. But these circumstances may change.
The cross-over point where more electricity was generated from wind than from nuclear sources was the year 2012 – and the balance has been in favor of wind ever since. We maintain that these data indicate that China has already made a strategic decision to rely on wind power (and WWS generally) more than on nuclear power for the foreseeable future. This is a sound choice, given that WWS sources are genuinely clean and green and mass producible – unlike nuclear or thermal sources. WWS sources are clean because fossil fuels and carbon emissions are minimally involved and the sources rely increasingly on recycled materials – whereas nuclear sources rely on mined uranium and its carbon-intensive transport around the world. WWS sources are green because they are genuinely renewable, whereas nuclear sources rely on uranium extracted from a fixed supply in far-distant locations. And WWS sources are mass producible (all products of manufacturing) with declining costs associated with the experience curve, whereas nuclear reactors tend to be built in one-off fashion and do not generate an experience curve (indeed as their costs rise so they generate a “negative” experience curve).8 Our point is that WWS sources are superior to nuclear in terms of their being clean, green and mass producible – so that the clear preference for WWS power over nuclear power in China is readily understood.
China vs US experience with renewables
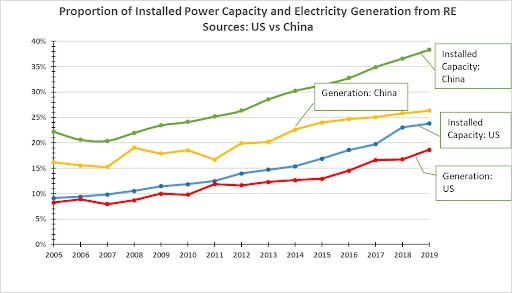
It is a matter of some interest to compare this Chinese experience with the comparable US experience, that is, the two global leaders in production of greenhouse gases, over the same decade – as shown in Fig. 6. Are there clues to two very different energy strategies here?
|
Fig. 6 US vs China: WWS sources of electric power (capacity and generation), 2005-2019 Source: Authors, based on data for China from CEC (this article) and for the US from the EIA |
Figure 6 reveals that the US too has improved the green foundations of its electric power system by increasing the percentage of WWS over the past decade – but not to the same extent as China. According to the US Energy Information Administration (EIA), US electric generating capacity based on WWS sources rose from around 12% in 2010 to 24% in 2019 – a 12% green shift in the decade, bringing the US system to the point where China started the decade. In terms of electricity generated, the US green proportion (from WWS sources) rose from 10% in 2010 to 19% by 2019, or a 9% green shift in the decade. One can only wonder what the US might have achieved had it not been distracted by the quest for “energy independence” based on continued extraction and refining of oil and gas (particularly shale oil and coal seam gas, achieved via hydraulic fracture, or fracking. But that is another story.
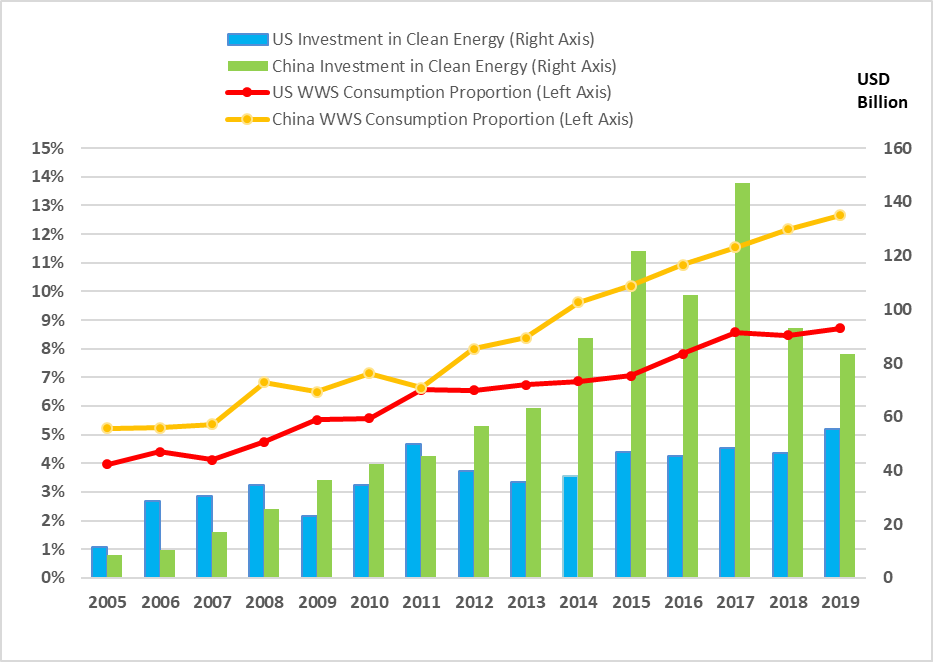
When we turn to energy consumption overall, we see that Chinese energy consumption from WWS sources rose from 7% in 2010 to 12.6% in 2019 (or 5.6% shift over the decade) while for the US the chart reveals that consumption sourced from WWS rose from 5.6% in 2010 to 8.6% in 2019, or a shift of 3% in the decade. Over the 14 years from 2005 to 2019, China invested US$ 947 billion in clean energy development (i.e. nearly a trillion dollars), defined here as WWS, compared with the US investment over the same period of US$ 569 billion. China surged past the US in terms of clean energy investment in 2009, as Figure 7 demonstrates.
|
Fig. 7: US vs China: WWS Consumption Proportion and Investment in Clean Energy, 2005-2019 Data: Authors, based on CEC (for China) and IEA (for the US) |
Greening within China’s energy system overall
In previous posts we have assessed evidence that China’s total energy system (across all sectors – power, industry, transport, domestic) might be greening. And we have found evidence that China’s annual increase in fossil fuel consumption across all sectors – burning of coal, oil and gas in power generation, in industry, in transport and in households — exceeded the electric power generated from green (WWS) sources for that year — up until 2011. But in each year after that, we found that green power generated each year exceeded the increase in fossil fuel consumption for that year. Assuming that the Chinese figures are reliable, this was an important finding – not replicated to the best of our knowledge by any other analysts of China’s energy trends. It is therefore of interest to know whether this tendency been continued through to 2018 and 2019. Updating our results to 2019, we present the results in Fig. 8.
|
Fig. 8. China’s Increase in Fossil Fuel Consumption vs Renewable Electricity Generation from WWS sources Source: Authors, based on NBS and CEC data |
In this comparison we put all increases in fossil fuels into a common measurement framework – and instead of using coal-equivalent (as in the Chinese data) or oil-equivalent (as in the EIA and BP Statistical Review) we use electrical equivalent, equating the energy produced across sectors in terms of terawatt-hours (TWh) of equivalent electrical energy. This is consistent with China’s stated strategy of rapid electrification of its energy system. It enables us to make a direct comparison between extra energy added each year from fossil fuel sources and the green electricity produced that year from WWS. Again, we find that green electricity generated, in terms of TWh in 2018 and in 2019, exceeds the increase in total fossil fuel consumption for that year (again measured in terms of TWh). This situation has been maintained since 2012, with the green electricity generated each year exceeding the increase in fossil fuel consumption for each year.
We offer this as a clear indication that in the sense specified, China’s whole economy is greening, and not just the power generation sector. It is greening in the sense that green electric power generated each year exceeds the total increase in fossil fuel consumption across the economy as a whole. Note that the total fossil fuel consumption each year exceeds green electricity generation by a wide margin – but in terms of change in fossil fuel consumption, the change each year is inferior to the green electricity generated from WWS sources. It is the trend that we are highlighting with this result – a trend that can be expected to culminate in green power generation exceeding total fossil fuel consumption. This is the most fundamental demonstration that China’s total energy system is greening faster than it is blackening – albeit within a large and growing black (fossil fuelled ) system overall and with a growing nuclear power sector.
Again it must be emphasized that China’s total energy system is still blacker than green with 87.3% of its energy consumption from both fossil fuels and from nuclear in 2019. We will of course be following the 2020 results, buffeted as they will be by the Covid-19 pandemic, with great interest.
China’s green energy policy settings
Much has been made of the point that China’s ND&RC and NEA have dismantled some of the policy supports for renewable power in 2019, such as subsidies paid through national governmental financial appropriation. While some outlets have interpreted this move as being hostile to renewables, we propose that it should be interpreted otherwise as a long-term bet on the viability of renewables. It indicates that Beijing now views renewables as mature industries that can stand on their own feet – with support from other policy settings such as China’s national carbon market that provides relentless pressure in favor of low-carbon industrial alternatives – even if its introduction has been delayed.9 China also provides extensive policy support for renewables and other clean energy options (batteries, EVs, FCVs) through provincial-level investment incentives as well as policy loans provided through the China Development Bank and the China Export-Import Bank. It has to be admitted that the last three years which have seen an increase in coal consumption have been a backward step for China, one that is not in the country’s interest in terms of reducing its dependence on fossil fuels.10 At the same time, in the midst of the current increase in coal fired power, promoted by provincial governments, the central government is seeking to curb the increase; in June 2020 a six-Ministry policy was issued which sets limits to coal-fired generation, and in particular a limit of 1,100 GW of thermal capacity for 2020 (compared with 2019 total of 1,191 GW).11 Even when it is acknowledged that levels of coal burning have increased in the past two-three years, the green trend towards a rising proportion of electricity sourced from WWS continues.
China’s international energy investments
A source of continuing concern is China’s energy investments in other countries, such as through its Belt and Road Initiative (BRI). The concern is that while China is indisputably greening its domestic power sources, it may not be doing the same for its international investments. While data on this question is scarce (particularly for 2020) we may consult public sources such as the Boston University Global Development Policy Centre (GDPC), which tracks BRI investments in energy projects around the world, and specifically in countries like Pakistan that have a heavy reliance on China and BRI investments. The latest data from the GDPC for BRI investments in energy projects in Pakistan reveal that thermal investments (coal and gas/LNG) by 2019 reached $8.3 billion (covering 7 projects); nuclear power investments reached $8.4 billion (3 projects) and WWS investments reached $5.8 billion (8 projects).12 The best that one can say about these projects is that they do not favor thermal and nuclear overwhelmingly, and provide for some investment by projects that will generate energy from WWS sources. Clearly China is not making any obvious moves to translate its global dominance of WWS industries into massive investments in WWS projects abroad.
Concluding comments
In this article we have updated our previous contributions to reveal a continuing strong trend towards the greening of China’s electric power system, particularly in the domestic context. We have done so through demonstrating a clear greening that outranks blackening in terms of added electric power capacity, in terms of investment in new generating capacity, and in terms of actual green electricity generated. Our prime exhibit is Figure 4 which clearly shows the greening tendency that has operated for the past 12 years. This is a trend which is linked to the contribution made by renewable sources (WWS) to China’s energy security, given that this green power generation is based on manufacture of renewables devices (solar cells, wind turbines, batteries, EVs and FCVs). As products of manufacturing there is a continuing cost reduction in each of these industries associated with the learning curve. We would suggest that this is a chart that could enhance reports from the IEA, IRENA and other multilateral agencies.
Moreover, we have compared China’s results in greening its electric power system with the comparable results for the US, where there has likewise been a greening tendency but not to the same degree as in China. We link these discrepancies to the fact that China and the US have been pursuing quite different energy strategies. The US for the past decade has been engaged in a quest for “energy independence” based on a deepening of its commitment to fossil fuel extraction and burning (via shale oil and coal seam gas). By contrast, China is clearly following a strategy of electrification and urbanization, with rising levels of green electric power reducing the country’s dependence on fossil fuels (both as imports and as domestic industries) where reliance on fossil fuels is reduced through the scaling up of renewables (from WWS sources) as well as nuclear sources. From this perspective, the stop-start process of dismantling the country’s coal industry, and the continued burning of coal as fuel in the power industry and other industrial sectors, is a step backwards, and not in China’s interest. China’s energy strategies remain an enigma.
Notes
For our earlier contribution, see JM and XH (2017) The greening of China’s energy system outpaces its further blackening: A 2017 update here.
Note that our results in this article refer to domestic power generation, and not to China’s international power generation activities and investments in other countries’ power generation via the Belt and Road Initiative. This international dimension will have to be the subject of a separate article.
Similar conclusions are reached by other well-informed observers. See the 2020 report by the Asia Society Policy Institute (ASPI), David Sandalow, CHINA’S RESPONSE TO CLIMATE CHANGE: A STUDY IN CONTRASTS AND A POLICY AT A CROSSROADS.
The capacity factors for each source of electricity reveal efficiency levels of generation. Data for China in 2018 are reported by Yiang, Yu and Wang (2019) as: hydro 39.7%; wind 20.6% and solar PV 14.4% — as compared with capacity factors reported for the US (by EIA) as hydro 45.2; wind 36.7%; solar PV 27%. The lower capacity factors for China reflect the curtailment of renewable sources pending grid upgrades that would allow all renewable power generated to be uploaded and utilized. Source for China. Source for US.
See the International Renewable Energy Agency (IRENA), Renewable energy capacity statistics 2020, here. Note the slight discrepancy between the CEC data for China’s building WWS capacity in 2019 (759 GW) and IRENA data (771 GW) which include all sources of renewables.
China’s annual investments in the total grid, covering generation as well as transmission infrastructure, has hovered around $80 billion (or 800 billion RMB) in recent years. See IEA data.
We thank the reviewer for pointing out that manufacturing of nuclear power plants in South Korea, China and Russia has some elements of mass production, whereas there are no such cost reductions in current European and Canadian plants. The non-OECD countries control costs by building multiple copies of a common design, not one-off versions. That’s the principal reason why their costs are below those of the US and France. Indeed, back in the 1970s and 1980s, the French, Canadians and others built a lot of cheap nuclear power that way, which is why French power is still low-cost and low-carbon today.
For a discussion of China’s reversal of the decline in coal burning, see the article by Feng Hao and Tom Baxter at China Dialogue.
The Water (hydro) projects amount to investment of $3.8 billion and cover 5 mainstream projects. The solar power project amounts to $1.5 billion – the Quaid-e-Azam Solar Park Phases I and II; while there are two wind projects accounting for $0.47 billion up to 2019. The solar PV project being built in the Punjab province of Pakistan has been plagued by delays and contractual disputes.


