The Greening of China’s Energy System Outpaces its Further Blackening: A 2017 update
John Mathews with Xin Huang and comments by Mark Selden and Thomas Rawski
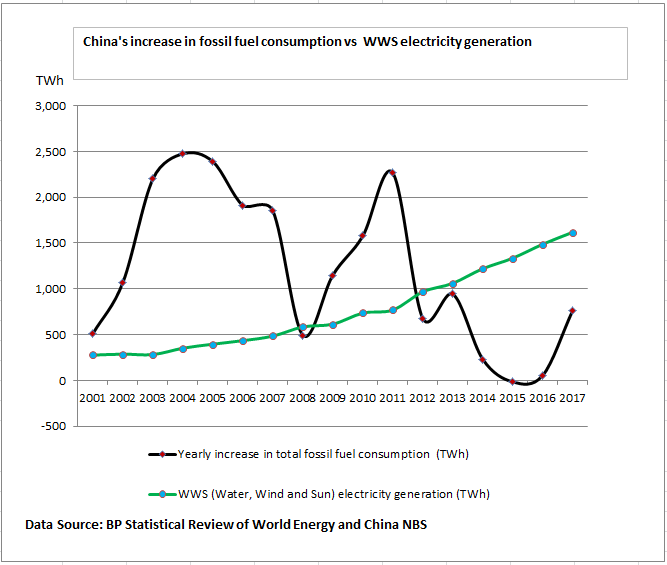
China’s green energy shift is now attracting increasing attention, as its strategic implications become clearer. In a recent article in Foreign Affairs, Amy Myers Jaffe has argued that China is effecting a “pivot” to green and clean energy that puts the country on a superior footing in international competition – particularly competition with the United States, that remains committed to its fossil fuel industries.1 Jaffe cites a number of statistics and trends, such as the shift to green power generation and the shift to electric vehicles (EVs) – but she does not offer any definitive demonstration of China’s greening. We tackle this central issue in this article, and offer fresh evidence that in a fundamental sense, China is indeed greening its total energy system. What we do is construct a picture of China’s total fossil fuel consumption over the past decade where coal, oil and gas consumption are aggregated not just in terms of coal-equivalent or oil-equivalent but in electric power-equivalent (in TWh) – so that a direct comparison can be made between burning of fossil fuels in aggregate and generation of electric power from renewable sources (i.e. from water, wind and sun). What we show is that in each of the past six years, from 2012 to 2017, China’s increase in fossil fuel burning in aggregate has been exceeded by the generation of green electric power. In this precise sense, where “blackening” is defined as the increase in fossil fuel consumption in aggregate (across the entire economy), and “greening” is defined as green electric power generation, we can demonstrate that in each of the past six years, China’s greening has outpaced its blackening – as shown in Fig. 1.
|
Fig. 1 China’s increase in fossil fuel consumption each year vs WWS electricity generation in the same year |
We provide the details of this demonstration below, in Table 5. What it demonstrates is that China’s green power generation is relentlessly rising, doubling every six years, and increasing at an average rate of 20% per year. Up until 2011 the yearly increase in fossil fuel burning exceeded the green power generation each year (fluctuating according to global economic conditions, with a steep dip in 2009 following the global financial crisis). But green power generation after 2012 has consistently exceeded the yearly increase in fossil fuel consumption. The point to make here is that this is a definitive demonstration that encompasses the entire Chinese energy system which has until recently been totally dominated by the burning of fossil fuels. Indeed, on its way to becoming the world’s largest manufacturing system and largest trading system, powered by the world’s largest energy system, China followed the pathway blazed by all previous industrial powers (from Britain and Germany et al through the US and then Japan, Korea and Taiwan) in building an energy system based on burning fossil fuels. In China’s case this meant building domestic systems for production and distribution of coal, then oil and gas – and then expanding these systems to encompass imports. China has now become the world’s largest importer of oil and gas, and a growing importer of coal – all increasing its vulnerability or diminishing its energy security. And China is by far the world’s largest consumer of fossil fuels, reaching a total of 4 billion tonnes of coal-equivalent in 2017. Most observers see this and the associated carbon dioxide emissions, which overtook those of the US in 2006 to make China the world’s largest emitter of carbon, and conclude that China is doomed to decades of fossil fuel dependence, threatening the future of our civilization (even if China did not invent and propagate the fossil-fuel model of industrialization). We seek to demonstrate that this gross picture of an enormous ‘black’ fossil-fuelled economy conceals the real trends towards greening that are sprouting within it.
Our project of keeping a close eye on China’s green shift now has greater relevance than ever. Our practice has been to focus on the electric power system in China as proxy for the economy as a whole. We have been demonstrating for many years now that the green power generation each year exceeds the increase in coal fired power generation. Data has now been released from China’s National Energy Administration (NEA) that enable the changes recorded in the year 2017 to be integrated into previous analyses. The headline result is that China’s steps in decarbonizing its electric power system have continued into 2017. When these steps are linked to the decommissioning of portions of its carbon-intensive heavy industry and promotion of an electric vehicle industry, continue to deepen. China maintains its role as driver of the global green shift.
How real is the “green pivot” referred to by Amy Myers Jaffe, or what we have been calling China’s “green shift”? It is indeed very real, reflecting the fact that China’s leadership recognizes that its continued reliance on fossil fuels would lead to intolerable levels of urban pollution as well as geopolitical pressures that would undermine energy security. So China has been greening its energy system as fast as it is able to do so – across all sectors but in particular in power generation through greater reliance on renewables, in transport through greater reliance on EVs, and in industry through greater reliance on electrification (with rising levels of renewable power) rather than fossil fuel burning.
So there is a green shift operating at the level of the entire economy. The green shift is more sharply evident when we narrow the focus to the electric power generating system. In this article we present detailed data on China’s green shift in electric power, taking the story up to the year 2017 and updating previous work.2 We offer new analyses that take the story up to targets for 2020, by which time China is likely to have achieved clean energy targets (utilizing water, wind and sun) with capacity of more than 800 GW – meaning that China would be the world’s dominant clean energy power with more than 1 trillion watts (1 terawatt TW) capacity of clean power by the early 2020s. At the same time, however, China, the world’s leading producer of greenhouse gases, maintains a continuing dependence on coal for electric power, albeit with declining dependence. The Chinese government seems to be maintaining a cap on coal utilization for electric power generation of 1,100 GW (1.1 TW). This is consistent with the apparent attempt to maintain a cap on total fossil fuel consumption of 4 billion tonnes of coal-equivalent.
The scale of China’s continued reliance on fossil fuels, and in particular on coal, remains staggering. In 2017 China remains a black economy, with severe dependence on coal-fired power. China’s coal consumption in 2017 appears to have risen slightly – according to still-provisional data. While coal-fired power stations continue to be closed, those remaining appear to have burnt more coal in 2017 than in 2016, making China still the world’s largest coal-burning country. The slight increase in 2017 is nevertheless still well below China’s peak coal consumption and production reached in 2013; it does not reverse the downward trend in China’s coal dependence. If we translate China’s total fossil fuel burning system of 4 billion tonnes per year into equivalent electrical units, namely around 32,000 TWh (or 32k billion kWh), and compare that with the scale of generation of green electric power (derived from water, wind and sun) at 1.6k TWh, we see that China’s green power production is still only equivalent to 1/20 (5%) of the country’s total fossil fuel burning system. Another perspective on China’s fossil fuel burning is to examine the whole-of-economy data on fossil fuel consumption, which has risen from 1.36 billion tonnes of coal-equivalent in the year 2000 to 3.78 billion tonnes coal-equivalent in 2015. So in 15 years China added nearly 2.5 billion tonnes coal-equivalent to its annual burning of fossil fuels. (For details see Table 3B below.) It is greening at the margins – but there is still a long way to go to green this enormous black system.
In this article we also update the trend which shows that China’s growing utilization of green energy outweighs its small and barely increasing reliance on nuclear power. To the extent that China continues to build nuclear reactors, this appears to be largely for business reasons and overseas consumption. It seems to be a case that “If you want nuclear power, China will build it for you.” That is, China’s continuing development of nuclear power appears to be more for overseas sales than for domestic production – as we discuss below.
China’s electric power trends
As in previous articles we focus on China’s green power shift in electricity generation, as proxy for the country’s wider energy trends. Of course China consumes a lot more energy than it generates in terms of electric power (such as the burning of coal in heavy industries like steel and cement) and the burning of oil in transport) – but the shift in electric power from “black” (largely coal fired) to “green” (largely based on renewables) is striking.
China’s energy story can be told through two principal charts, one showing annual electricity generated from various sources up to and including 2017, and a second chart showing China’s domestic capacity additions and the rising proportion attributable to water, wind and sun – again including data for the year 2017.
|
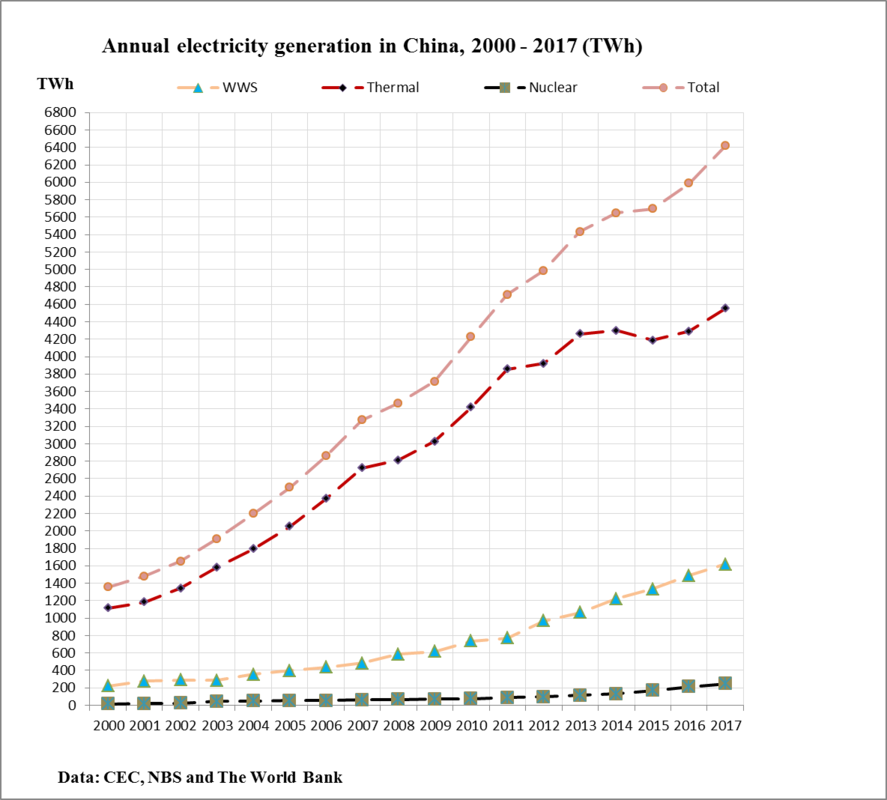
Fig. 2A. Annual electricity generated in China, 2000-2017 (TWh) |
|
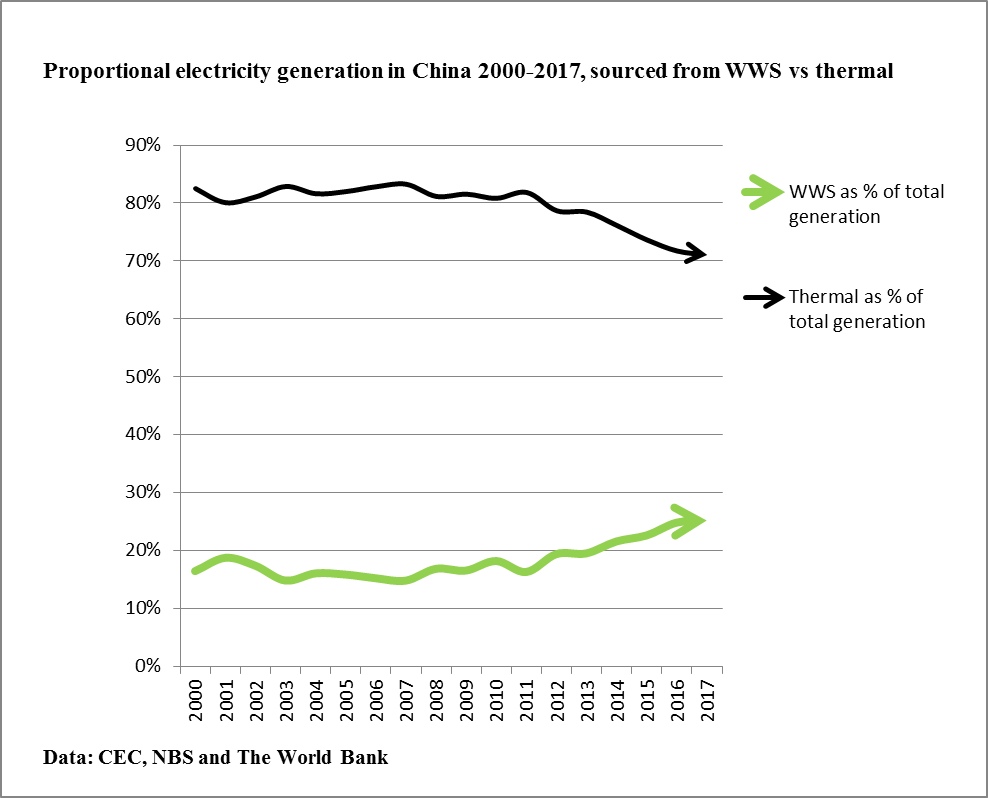
Fig. 2B. Proportional electricity generation 2000-2017, sourced from WWS vs thermal |
Fig. 2A reveals that total power generation in China has risen from around 1400 TWh in the late 1990s to 6,400 TWh (or billion kWh) in 2017 – by far the largest of any country in the world. By contrast, the US power generation in 2017 was 4,015 TWh. (At the same time it needs to be noted that China’s per capita power generation remains far behind that of other industrialized countries like the US – with China’s per capita power generation in 2016 reaching 3,776 kWh compared with the US at 11,957 kWh.) It is this electric energy system that powers China’s vast manufacturing system – with a clear inflection point in 2001 when China joined the World Trade Organization (WTO) and effectively declared itself ‘open for business’. The annual rate of growth of the power generation system in the period from the year 2000 to 2017 has been 20.9% — an astonishing rate of growth for a system as large as this. The orange stippled line shows the overall system’s expansion (reaching 6,400 TWh in 2017) while the red interrupted line shows electricity generated from thermal sources – essentially, burning coal. This source reached 4,551 TWh in 2017 – or 71% of the total, and can be seen to be flattening in the last two to three years. Meanwhile renewable sources (which we define as electricity generated from water, wind or sun) have been rising even faster than the total system, at 30.2% per annum (shown as triangles on the chart), reaching 1,618 TWh in 2017, or 25% of the total.
It is the trends that are important and which bring out the greening tendencies of this system. Fig. 2B shows the rising proportion of power generated from WWS sources as a bold green line, reaching 25% in 2017, while the black line shows the falling proportion from thermal sources, dipping to 71% by 2017. The bold green line shows that WWS sources increased proportionally from 15% in 2007 to 25% in 2017, or a 10% increase in the proportion of WWS sources in a decade, with major gains in the years 2012 to 2017. This is a clear measure of China’s greening of its electric power system; no other country comes even close to this pace of green change. Meanwhile the black proportion of power has fallen from 81% in 2010 to 71% in 2017 – or a 10% change downwards in less than a decade. This is another indication of the pace of change, namely China’s falling dependence on fossil fuels for power generation.
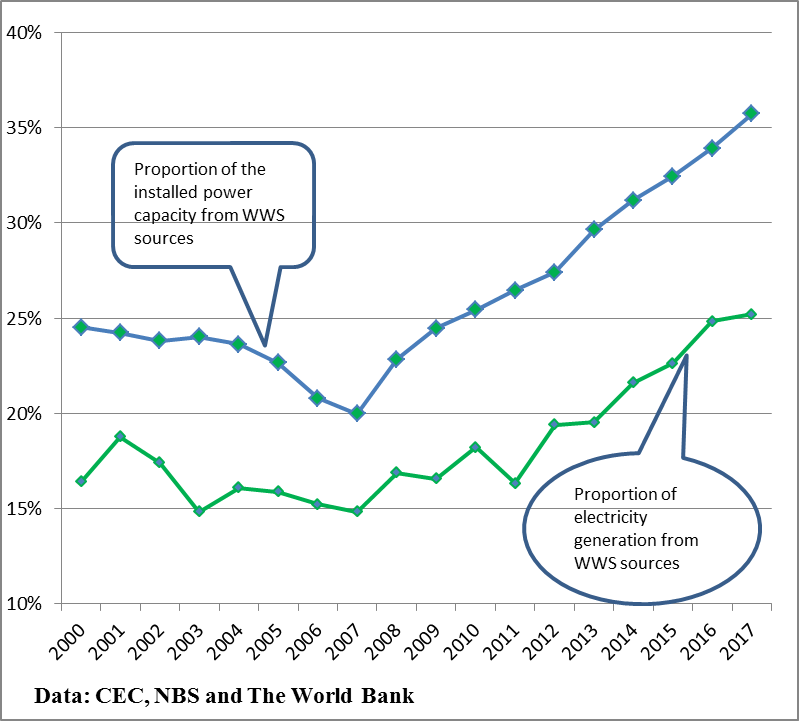
When we turn to capacity additions made in 2017, the picture is even more striking. Fig. 2 shows that the proportion of electric generating capacity sourced from water, wind and sun exceeded 35% by 2017 – up from 20% in 2006 when China’s green shift started in earnest. This is a 15% shift towards green power capacity in just over the past decade – an even more striking rate of change of the green shift. If carried through at the same pace over the next decade, China’s power capacity would be more green than black– by 2028. This is why China’s leadership can confidently make assertions that the country’s carbon emissions will peak before 2030.
|
Fig. 3. China: Proportion of electric capacity and power generated from WWS, 2000-2017 |
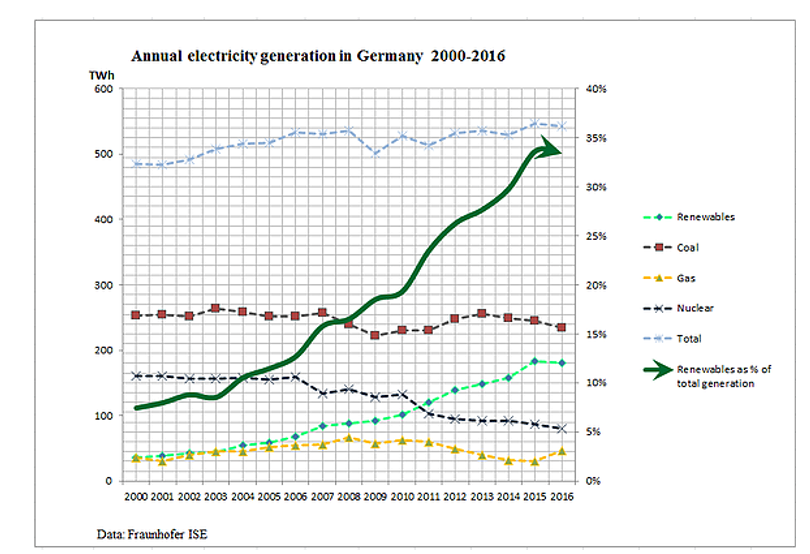
A comparison with the situation in Germany is instructive – as shown in Fig. 4. Here we see the country’s dependence on coal-fired power reduced, and its dependence on nuclear drastically reduced, while reliance on renewables steadily grows. Germany’s two major parties – which have just renewed their coalition agreement – are committed to phasing out dependence on coal altogether.
|
Fig. 4. Annual electricity generation in Germany, 2000-2016 |
Germany’s total power generation reached 520 TWh in 2016 (around one twelfth of China’s) while under the influence of German federal government policy (Energiewende, or “Energy transformation”) the proportion attributable to WWS sources approached 35%.
China however is still a largely black energy power, with dependence on coal for power generation marginally increasing in 2017 over the level in 2016 – after successive falls each year since both coal consumption and production peaked in 2013. We discuss these trends in detail below.
China’s electric power statistics 2017
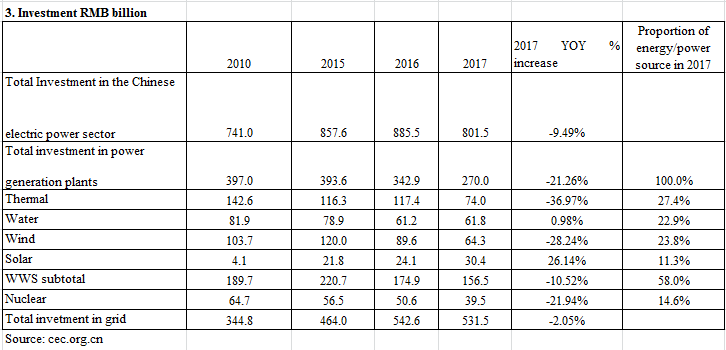
Detailed data for China’s energy revolution, couched in terms of (1) capacity additions; (2) electricity generation; and (3) investment in new capacity, are shown in Table 1.
 |
 |
|
Table 1. China’s electric power generation, 2010-2017: Capacity, Electricity generated, Investment |
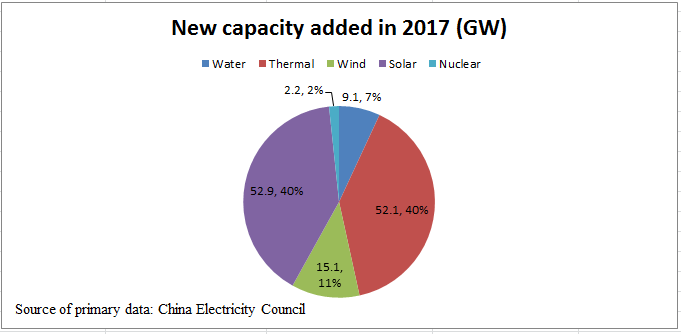
By 2017 China’s electric power capacity reached 1,777 GW, or 1.8 TW – by far the largest of any country in the world (compared with around 1 TW for the US). Capacity from renewable sources (water, wind and sun – WWS) reached 635.1 GW – making China a world leader in green energy with 25% of renewable energy in 2017 even as its fossil fuel consumption continues to rise. Capacity added in 2017 reached 131.2 GW, with 52.1 GW coming from thermal sources (coal, gas) and 77.0 GW from WWS sources. So new capacity from thermal sources accounted for just 40% of new capacity, while WWS sources accounted for 59% of new capacity. This is powerful evidence for the greening trend of China’s power system. But it is still a black system. By 2017 the system had thermal capacity of 1,106 GW compared with 635 GW for WWS sources; this means in terms of the total system that 35% capacity is reached by WWS sources. In terms of growth, thermal sources increased in 2017 only by 5% compared with 14% for WWS sources. Thus the green growth exceeds black growth. As for nuclear, just 2.2 GW new capacity was added in 2017, accounting for just 2% of new capacity added. What is striking is that solar capacity additions in 2017 exceeded those from thermal sources – with 52.9 GW being added from solar, compared with 52.1 GW from thermal sources. That’s a new solar power station at 1 GW being added each week, as well as a new coal-burning power plant being added each week. These trends are captured in Fig. 5.
|
Fig. 5. China, new electric capacity added in 2017 |
Table 1 (2) confirms that China’s electric power generation totalled 6,418 TWh in 2017, up 7.1% from the level in 2016. Power generated from WWS sources increased to 1,618 TWh, an increase of 9% on the level in 2016, and accounting for 25% of the total power generated.
When we look at investment (Table 1 (3)) we see that investment in the power system totalled RMB 801 billion in 2017 – marginally down on the level reached in 2016. The level of investment in WWS sources was down 10% on 2016 levels, which is concerning – but the level of investment in thermal sources declined even more, being down 37% on 2016 levels.
Trends over the past three years, spanning 2015 to 2017, offer striking confirmation of these greening trends in capacity, power generation and investment, as shown in Table 2.
|
Table 2. China’s electric power system trends, 2015-2017 |
The data in Table 2 reveal that in terms of capacity added in 2015-17, WWS sources outranked thermal sources by 34%; power generated over the three years saw WWS accounting for 34% of the total; and investment in WWS power sources outranked investment in thermal sources by more than threefold. Investment in WWS sources in 2017 totalled RMB 156.5 billion (or US$ 24.8 billion at an exchange rate of 6.3). Note that these estimates are markedly different from those provided by Bloomberg New Energy Finance (BNEF) in London. BNEF have issued their estimates for 2017, where they state: “Overall, Chinese investment in all the clean energy technologies was $132.6 billion, up 24% setting a new record. The next biggest investing country was the U.S., at $56.9 billion, up 1% on 2016 despite the less friendly tone towards renewables adopted by the Trump administration.”3 In April, the BNEF together with the Frankfurt School of Finance and Management issued their widely read report on ‘Global Trends in Renewable Energy Investment 2018’, in which it is stated that China invested $126.6 billion in renewable energy in 2017. Clearly China’s NEA is using very different definitions of clean energy investment from those utilized by BNEF. This remains an anomaly that we put to the parties involved and seek clarification.
Let us now look at the three WWS sources – solar, wind and hydro – and the targets for 2020.
Solar PV emerged as a major player in 2017, with 53 GW new solar PV capacity added (at a rate of more than 1 GW per week) exceeding new capacity from thermal sources (52 GW). This is the first time that China has added more solar PV capacity than coal or gas capacity in a single year – providing yet another indicator of the pace of the green shift. The solar PV capacity added in China in 2017 represented a 68% jump on the level recorded in 2016, and accounted for around half of global solar PV capacity additions. The Bloomberg New Energy Finance (BNEF) team in London calls this China’s 53 GW solar boom.4
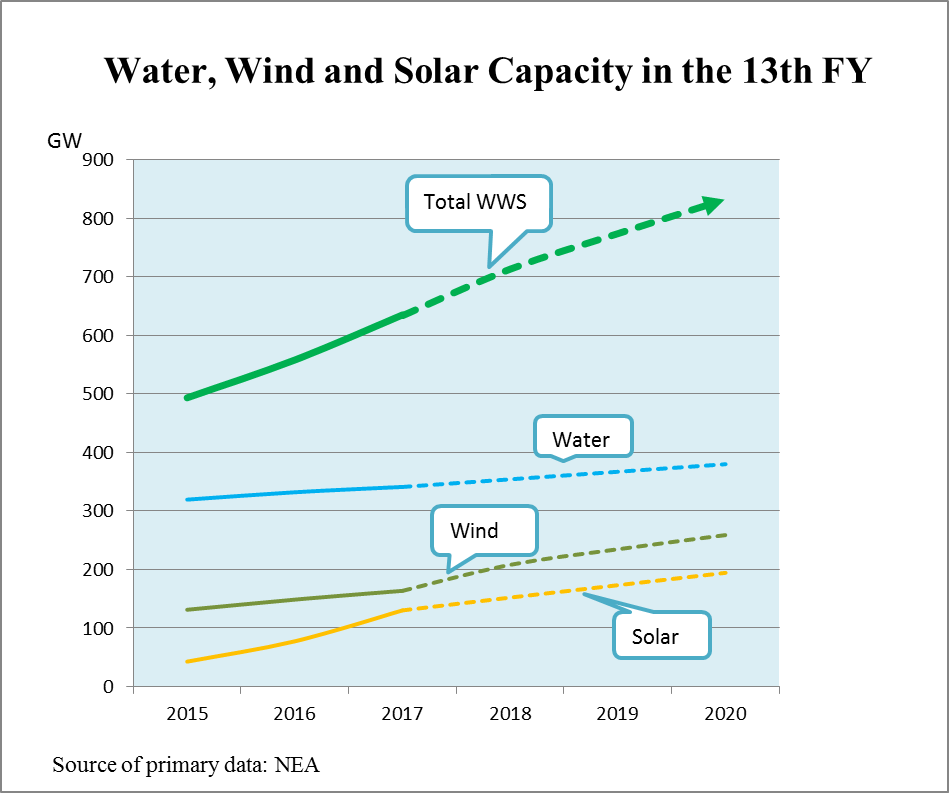
China’s cumulative solar PV capacity has now reached around 130 GW, with an official target set for 2020 at 165 GW – a target very likely to be exceeded. Some observers are predicting that China will reach a solar PV capacity of 250 GW by 2020.5 China’s record rate of solar PV capacity additions is clearly driving the accelerated rate of installation globally.
In 2017 China added 15.1 GW of new wind capacity, bringing the cumulative total of wind capacity to 163 GW. The target is to reach 260 GW installed wind capacity by 2020 – a target that appears to be eminently achievable.
In terms of hydropower, China added just 9.1 GW capacity in 2017 (upgrading existing dams) bringing the cumulative capacity to 341.2 GW – making China again the largest deployer of hydropower in the world. However, hydropower has reached close to its maximum practicable capacity in China, and the target for 2020 is set at just 380 GW – which on present trends seems unlikely to be exceeded.
China’s 2020 targets
According to China’s 13th Five Year Plan for Energy, issued by the National Energy Administration (NEA), the country’s targets for green power generation continue to emphasize a green shift. The official targets for WWS green power capacity by 2020 (as updated by the 13th FYP for Energy) are:
| Hydro | 380 GW |
| Wind | 260 GW |
| Solar PV | 165 GW |
| Total WWS | 805 GW |
The combined WWS target for 2020 is thus 805 GW. Indeed if the 2020 target for solar PV is raised in line with observer expectations, to 250 GW, then China’s green power capacity would be expected to reach 890 GW by 2020. China could then be expected to pass the 1000 GW (1 TW) milestone for green WWS power by 2021 or 2022 at the latest – the first country to do so. These targets, and cumulative capacities reached for hydro, wind and solar PV by 2017, with official targets for 2020, are displayed in Fig 5A.
|
Fig. 5A. Water, wind and solar capacity in China, with 2020 targets under 13th Five Year Energy Plan |
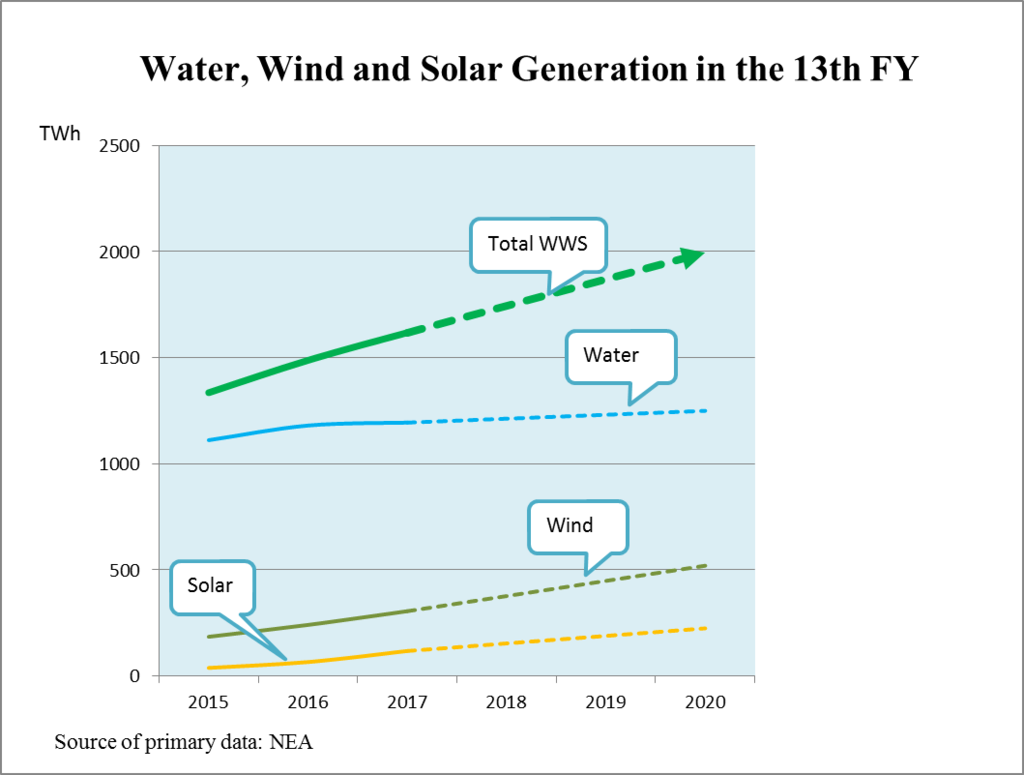
In terms of annual generation targets, NEA’s plan in 2016 set a 2020 hydroelectric generation target of 1250 TWh, with wind power reaching 429 TWh and solar PV power 150 TWh (based on capacity of 110 GW as in the original plan). In July 2017 the NEA adjusted these targets upward by 50 GW for each of wind and solar PV, and inserting these new capacities the generation targets become: hydro 1250 TWh; wind 520 TWh; and solar 225 TWh – making 1995 TWh in total as target for generation in 2020 (as displayed in Fig. 5B.)
|
Fig.5B. Water, wind and solar power generation in the 13th FYP |
Levels of curtailment in 2017
A striking feature of the 2017 results is that the levels of curtailment of renewable power consumption have markedly declined. It has been a source of great concern in China (and a source of foreign criticism) that much of the power generated by renewable systems (mainly wind and solar PV) is not actually supplied to the grid, because of grid integration issues. The news conference of National Energy Administration (NEA) (see here) of Jan. 24, 2018 confirmed that in 2017, 12% of wind power production was curtailed versus 17.2 % in 2016. Thus curtailment of wind energy production dropped 5.2 percentage points compared to 2016 even as the system absorbed much more of the wind power generated. For the case of solar PV, 6% of wind power production was curtailed in 2017 versus 10.3% in 2016; thus curtailment dropped 4.3 percentage points compared to 2016.These are becoming close to “normal” levels of curtailment.
China as an international renewables power
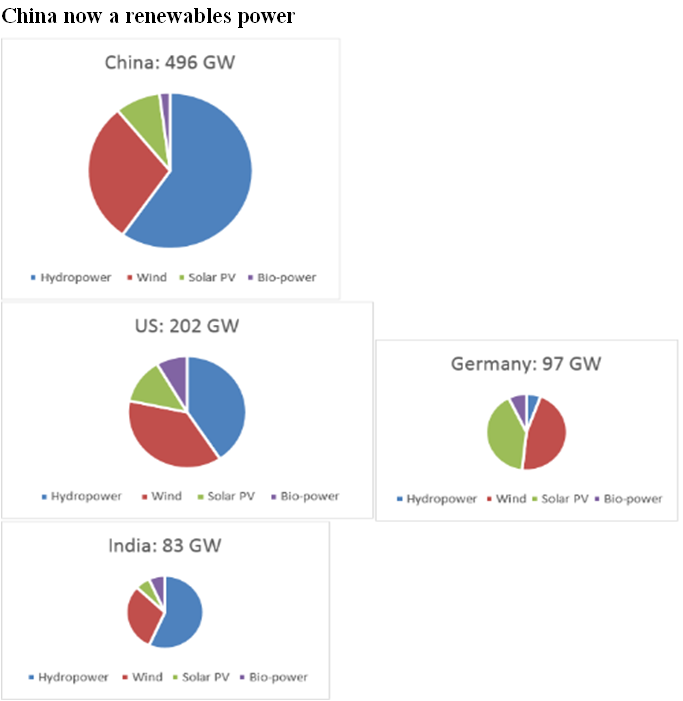
When the build-up in renewables capacity in China is compared with that found in other countries, China emerges as a global leader. The chart below (Fig.6) shows the situation utilizing data up to 2015; as data for other countries is made available for 2016 and 2017 the trends will likely be strengthened. Note that China’s WWS capacity has increased from 493 GW in 2015 to 558 GW in 2016 and reached 635 GW in 2017. At this rate, China will be a ‘terawatt renewables power’ by the early 2020s.
|
Fig.6. Renewables capacity (WWS) in China compared with USA, India, Germany |
China’s black, coal-fired energy system
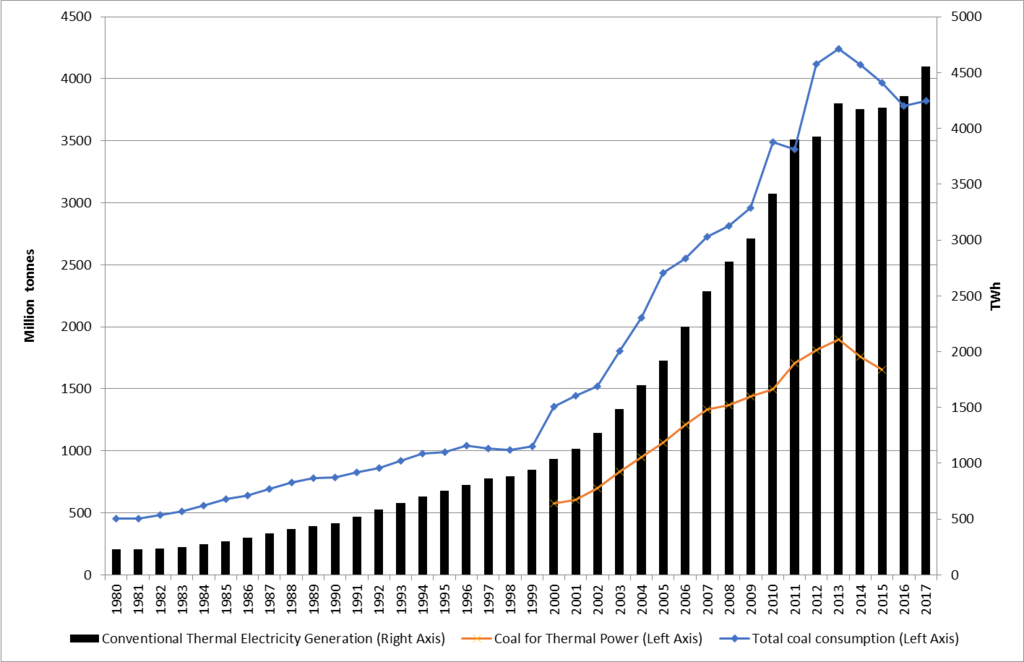
Alongside the greening of China’s electric power system there is the continuing issue of its black, coal-fired system, which also continues to expand (after a couple of years of contraction). China’s continuing reliance on coal for its electric power system is vividly captured in Fig.7. This chart reveals the reliance of China’s electric power system on coal; after contracting in the years 2015-2016 it expanded again in 2017. That is clearly a trend that is of great concern in China.
Statistics for total Chinese coal consumption in 2017 are not yet available. However, we can gain a feel for the likely level of consumption by examining the amount of total coal production in 2017 (3.45 billion tonnes) and total coal imports (0.27 billion tonnes). By adding these two totals, we see that the (apparent) total domestic consumption should exceed 3.72 billion tonnes, which is close to Brookings’ forecast of 3.82 billion tonnes.6 We use this figure of 3.82 billion tonnes in our charts below.
Firstly, we indicate the extent to which China remains a ‘black’ economy, in Fig.7, which indicates rising levels of coal-fired power generation and corresponding rising levels of coal consumption (largely in power generation), which peaked in the year 2013. The slight (apparent) rise in 2017 does not reverse the overall downward trend in coal dependence.
|
Fig. 7 China’s black electric power |
Source: Based on CEC data
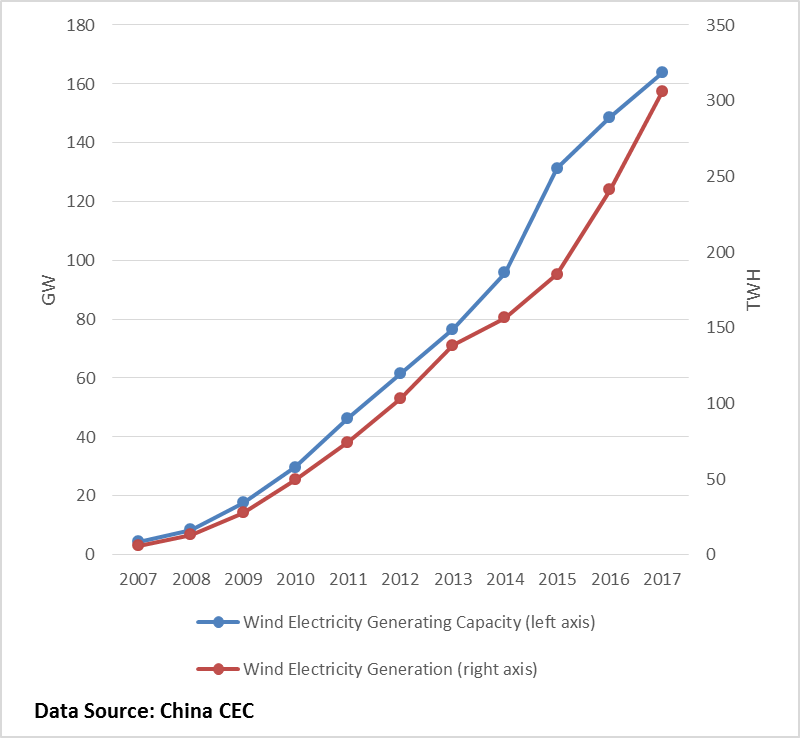
This black face of China may be compared with the green face, captured by the increases in wind power in China, shown in Fig.8.
|
Fig. 8 China’s green face: rising dependence on wind power |
The significance of this rapid build-up in wind power becomes clear when it is contrasted with the case of nuclear power.
China: wind power vs. nuclear power
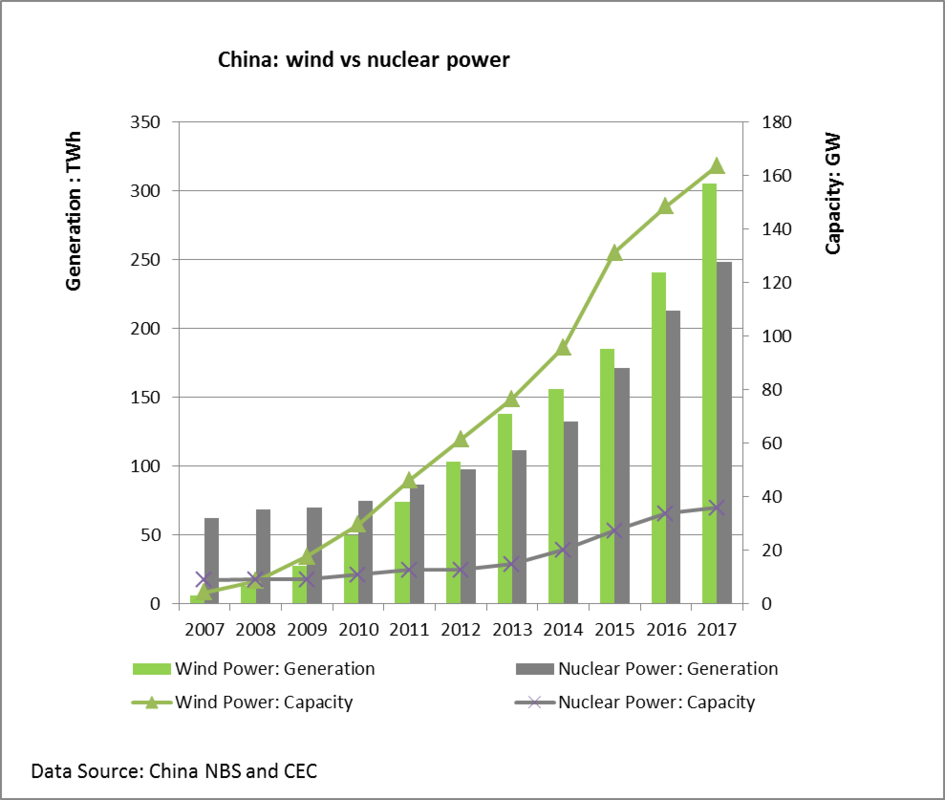
Since so many prominent international scientists (like James Hansen) continue to promote nuclear as a “clean” energy source for China, it is important to monitor the choices that China is making in its domestic energy investments. The chart (Fig.9) reveals that in terms of capacity additions, wind power outranked nuclear as early as 2008, while in terms of electricity generated, wind outranked nuclear by the year 2012 The gap between wind power and nuclear has only widened since then, as revealed clearly by Fig.9.
|
Fig. 9. Wind power vs nuclear power, China |
We interpret these data as revealed in Fig. 9 to mean that China has little intention of promoting nuclear power for its domestic consumption. But there is still a strong market for nuclear power in other countries (such as in Britain), and China is doubtless calculating that it can sell its advanced nuclear technology to countries that are prepared to pay for it.
China’s continuing enormous fossil fuelled energy appetite
To put China’s green shift into perspective, we take this opportunity to report on the latest data revealing the scale of China’s burning of fossil fuels, across the entire economy. Table 3A looks at the scale of coal consumption, as well as oil consumption and gas consumption, and aggregates these fuels consumed in terms of million tonnes of oil equivalent. In Table 3B we reproduce the same data in terms of million tonnes of coal equivalent. It is in Table 3B that we can see that there is an apparent cap on fossil fuels consumption of 4 billion tonnes coal-equivalent. In both Tables we also provide the energy-equivalent in terms of electric power generation, denominated in TWh. (It is technically possible to do this because it is all energy that is being measured, albeit with different units.) This will enable us to make direct comparisons between fossil fuel burning and green electric power generation.
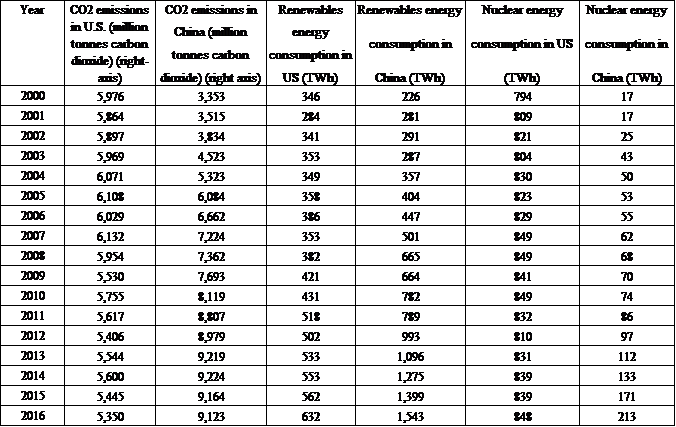
Then to give a sense of the comparative scale of fossil fuel burning as between China and the US, and carbon dioxide emissions, we reproduce the latest data (up to the year 2016) in Table 4.
|
Table 3A: China’s fossil fuel consumption 2000 – 2017 in million tonnes oil equivalent (toe) and TWh |
|
Table 3B: China’s fossil fuel consumption 2000 – 2017 in million tonnes coal equivalent (mtce) and TWh |
|
Table 4: U.S. vs China: CO2 emissions, Renewables and Nuclear Energy Consumption (2000 – 2016) |
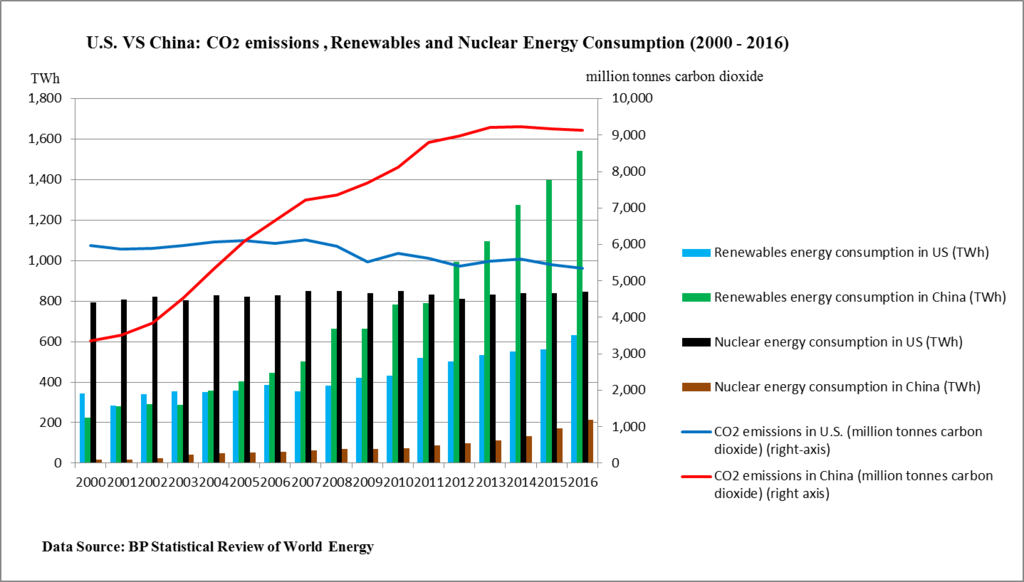
We display the most significant features from Table 4 in Figure 10, which includes data for carbon dioxide emissions.
|
Figure 10: U.S. vs China: CO2 emissions, Renewables and Nuclear Energy Consumption (2000 – 2016) |
Figure 10 shows that China’s CO2 emissions level surpassed those of the U.S. in 2006 and kept increasing before flattening out in 2013-2014. In this sense, one may say that China’s carbon dioxide emissions have already peaked. From 2007 to 2016, the rate of increase of the emissions level was 2.6% per annum {calculated as [(9123-7224)/7224/10]}, which is lower than the growth of China’s total fossil fuel consumption by 0.6%.
In terms of per capita level, China’s CO2 emissions are less than 40% (6.6 vs 16.6 tonnes) of those of the U.S. in 2016.
Figure 10 clearly depicts the different choices of U.S and China between renewables and nuclear energy consumption. By 2017 China was generating 1,618 TWh of renewable power from water, wind and sun (up from 1,543 TWh in 2016). This was more than seven times what China generated from nuclear power stations, which in 2016 came to 213 TWh. In the 10 years from 2007 to 2016, the U.S. consumed 8,386 TWh nuclear energy and 4,887 TWh renewables energy whereas China consumed 1,086 TWh nuclear energy and 9,708 TWh renewables energy – with renewables energy consumption more than nine times its nuclear energy consumption. The average annual growth rate of the renewables energy consumption was 20.8% [(1543-501)/501/10] for China and 7.9% [(632-353)/353/10] for the U.S.
The efficiency of China’s renewables generation
China had to start its renewables trajectory by using technology leveraged from the West, and its early efforts at generating green power were at a low efficiency level. While its efficiency has improved over time, through technology leapfrogging, China still lags the US in terms of the capacity factors involved in wind power and solar power generation. China’s capacity factor for solar PV generation is, for example, around 12% (meaning that China generates solar power at 12% of the theoretical maximum), while according to the US Energy Information Administration, the US capacity factor for solar PV and CSP is 27%.7 If this is indeed the case, then it represents a great opportunity for the US to offer its solar PV technology to China to improve China’s solar power efficiency, and thereby its contribution to reducing carbon emissions and mitigating climate change.
Is China greening its energy system faster than it is expanding its black system?
By putting all energy consumption data into common units, namely TWh of electricity consumption, we gain a feel for the relative growth of the ‘black’ fossil fuel energy system and the green power system. From Tables 3A and 3B, we see that the black, fossil fuel (FF) system expanded each year and reached a kind of plateau in the years 2013 – 2017.
Here we come to our crucial demonstration. In Table 5 we construct a picture of China’s total fossil fuel consumption each year since the year 2000, and then the increase in aggregate fossil fuel consumption each year (noting how it plateaued and actually reached below zero – or contracting — in the year 2015) – all shown in electric power generation equivalent units, or TWh. We then compare China’s green power generation (from water, wind and sun) each year with this increase in aggregate fossil fuel consumption. The yearly increases accelerated after China’s accession to the WTO in 2001, and suffered a major reversal in 2008 after the global financial crisis. But it is the recent trends that are of interest. What is striking is that the green power generation in each of the past six years – from 2012 to 2017 — exceeds the increase in aggregate fossil fuel consumption for the corresponding year. In a precise sense, and in aggregate across the entire economy, China’s greening exceeds its ‘blackening’ in terms of yearly increases in fossil fuel consumption, for each of the past six years. This is a greening trend across the entire economy that can only be interpreted as continuing – and leading within very few years to an energy economy that would be greener than blacker. The results are tabulated in Table 5 and illustrated in Fig. 1 above.
|
Table 5. China’s total energy system: Fossil fuel consumption vs green electric power generation |
Table 5 reveals that over the years until 2011 the increases in FF consumption exceeded green power generation – so that the rate of blackening outpaced the rate of greening. But from 2012 on, the green power generation in each year exceeds that of the increase in FF consumption, so that the greening trend has been outpacing the blackening. China’s green power generation has been doubling every six years, and increasing at an average annual rate of 20%. This is a trend that is very likely to be continued, because it is based on the fact that renewables devices are all products of manufacturing, not of digging or drilling stuff out of the ground. This is the key difference between the energy strategy pursued by China and that pursued by the US. China pursues a strategy that is linked to manufacturing and electrification, driven by rapidly dropping costs (due to the experience curve) – while the US has been pursuing a strategy based on non-conventional oil and gas, where there are no links to manufacturing and the cost future is highly uncertain. So what is driving China’s green shift?
What is driving China’s green shift?
There is a dominating factor driving China’s energy choices. While much of the commentary on China’s green shift assumes that it is motivated by climate change concerns, it seems to us that the factors driving China’s green shift are more prosaic and pragmatic. There are immediate pollution issues which are coming to be viewed with growing seriousness in China, and there is the issue of energy security. – growing dependence on fossil fuel imports, particularly oil imports for transport and coal imports for power generation. The growing gap between domestic production and consumption is worthy of close analysis, a topic that we propose to tackle in a subsequent article. As the gap between production and consumption expands, and dependence on imports grows, so the geopolitical limits to China’s energy expansion become more pressing. Without China’s shift to renewables, all of which are products of manufacturing, China would be facing extreme energy insecurity – with all the implications this would carry for dependence on fossil fuel geopolitical hotspots.
While many point to the enormity of China’s fossil fuel consumption, we seek to identify the process that has the potential to reduce and eventually bring China’s enormous levels of fossil fuel burning to an effective end. We see only one factor that offers any chance of this happening within the next two decades, and that is the shift to green power production, which is steadily accounting for more and more of China’s energy production, as well as the shift to electrification in industry and transport, with the opportunities so created to shift to green power. And we see the drivers of this green shift as being China’s concern to clean its filthy pollution problems, and relieve itself of the environmental consequences of an energy policy associated with continued reliance on fossil fuels.
China’s greenhouse gas emissions
Finally, it is important to note that China’s green power shift is already having an impact on the country’s greenhouse gas emissions, which are now the largest in the world. We depict China’s CO2 emissions in Table 4, and Fig. 10, as contrasted with those of the US. We note the recent comments from the China Climate Action Tracker:
China’s CO2 emissions appear to have peaked more than a decade ahead of its Paris Agreement Nationally Determined Contribution (NDC) commitment to peak its CO2 emissions before 2030. The latest analysis from the Climate Action Tracker, indicates that CO2 emissions may, in fact, already have stopped increasing and reached peak levels.8
We concur with this expectation based on our 2017 analysis of China’s green power shift.
Xin Huang is a research assistant and financial analyst. She has worked in the financial sector in Australia and China
The Environmental Consequences of Chinese Development: A Comment
Mark Selden
In a book and a series of articles, many published at The Asia-Pacific Journal, John Mathews and collaborators have made a case for Chinese global leadership in renewable energy. That case centers on documenting the initial stages of a relative shift from fossil fuel-driven electric power toward renewable energy.
In the most recent article, Mathews and Xin Huang offer a detailed assessment of China’s fossil fuel consumption and its ambitious program highlighting conversion to renewable sources of energy within a framework of rapid expansion of energy use through 2017 and looking ahead. They observe that
“in each of the past six years, from 2012 to 2017, China’s increase in fossil fuel burning in aggregate has been exceeded by the generation of green electric power. In this precise sense, where “blackening” is defined as the increase in fossil fuel consumption in aggregate (across the entire economy), and “greening” is defined as green electric power generation, we can demonstrate that in each of the past six years, China’s greening has outpaced its blackening . . .9
This is an important finding. Yet China’s green energy program, widely touted as national policy by the Xi Jinping government, has stirred controversy.
China’s prioritization of renewable energy is an important phenomenon. Some have seen it as laying the foundation for global leadership, particularly at a time when the United States has effectively rejected the dominant conclusions of climate science and has effectively withdrawn from the Paris Agreement.
The question I wish to pose is how to assess the significance of these new green programs in the context of a comprehensive energy and development program in which China’s total power generation increased from 1400 TWh (billion kWh) in the late 1990s to 6400 TWh in 2017. China is presently the world leader in power generation, in the consumption of coal and other fossil fuels, and in the production of greenhouse gases, even as it lags far behind the US and a number of other rich countries in per capita production of greenhouse gases. To achieve the world’s highest economic growth rates in recent decades, China not only became the world leader in overall production and consumption of fossil fuels, it also became “the world’s largest importer of oil and gas, and a growing importer of coal.”
Mathews and Huang emphasize that even as China continued to expand its consumption of fossil fuels (at a rate of 20.9% per year over the last two decades), its renewables grew at a significantly faster pace (30.2% annually) with renewables increasing at their fastest pace in the years 2012-2017. A US comparison is fruitful. Between 2007 and 2016, “[t]he average annual growth rate of renewables energy consumption was 20.8% for China and 7.9% for the U.S.” Nevertheless, despite the steady growth of renewables, by 2017 China’s green power electricity generation was just 5% of that of its total consumption of fossil fuels. These figures are inclusive of fossil fuel consumption for automobile use at a time when China is the world’s largest builder and buyer of automobiles. By the early 2020s, according to government growth projections, China would not only be the world’s largest producer of greenhouse gases, it would also possess the world’s largest capacity for green energy production with one trillion watts (1 TW) of electric power.
Mathews and Huang recognize that China’s fossil fuel consumption is projected to continue at least well into the 2020s as a foundation for China’s high-speed growth. Their positive assessment of Chinese development strategy is premised on a projected transition based on continued expansion of renewables together with a steady reduction in fossil fuel consumption overall that is not slated to begin for some years. 10
For the present, China continues to expand black energy consumption while renewables occupy a steadily growing but small share of the nation’s rapidly rising total energy consumption. This outcome is a product not only of China’s high growth rates but also of expanded coal, oil and natural gas consumption and the low efficiency of Chinese renewables—less than half that of the US and other technologically advanced countries. In 2016 fossil fuels accounted for 87% of China’s primary energy consumption compared with 85% in the US. The result is that China continues to drive global warming on a scale beyond that of any other nation.
An environmental perspective, one that recognizes the necessity to question the God of Growth measured by GDP, requires assessing the consequences of China’s massive production of steel, coal, aluminum, cement, plastics, and other energy-intensive and polluting products. By 2015, China produced half or more of the world’s steel, aluminum, and cement, and 48% of its coal.11 As energy specialist Vaclav Smil observed, China consumed more cement in the years 2011-13 than the US did in the entire twentieth century.12 The pace of Chinese construction, moreover, continues to accelerate both domestically and internationally.
For example, Chinese officials have announced plans to complete 165,000 miles of roads by 2030, nearly 3.5 times as long as the US interstate system. In addition, China has launched a Belt and Road Initiative (BRI) and an Asian Infrastructure Investment Bank (AIIB) with the participation of 42 countries (as of April 2017) pledging to provide major financial support for developing countries throughout the Asia-Pacific and beyond.13 All of these initiatives mean expanded demand for fossil fuels. Without addressing the developmental consequences of these programs, it is certain that in each of these realms China will increase the already extreme burden on the environment, initially in China and eventually regionally and globally.
In short, it is essential to look beyond the accelerated production of renewable energy to assess the overall impact of Chinese development policies at home and abroad on climate crisis and the human prospect. Indeed, this is perhaps the central challenge to global development theory: China’s high speed growth of recent decades has achieved important goals including substantial increases in per capita incomes, extensive urbanization, and rising consumption associated with its advance to middle income status. In the process, it has shared with many other countries sharply rising income inequality, precarity of employment with the dismantling of substantial parts of state sector enterprise and the rise of temporary and contract work. It is time to place environmental degradation at the center of the discussion in assessing human development in the Anthropocene age.
Mark Selden is an editor of The Asia-Pacific Journal.
Please allow three brief comments on the excellent summary offered by Mathews and Huang.
1. The authors refer to China’s “growing dependence on fossil fuel imports, particularly oil imports for transport and coal imports for power generation” and refer to a “growing gap between domestic production and consumption” (2018, p. 14).
These statements apply to oil, but not to coal. Data on the National Bureau of Statistics web site place annual coal imports during 2013-2015 at 0.32, 0.29 and 0.20 billion tonnes respectively. Mathews and Huang give a 2017 figure of 0.27 billion tonnes. There is no upward trend in coal imports, no “growing gap between domestic production and consumption” of coal, and no “growing dependence on . . . coal imports for power generation.”
2. While accurately describing China’s massive expansion of renewable energy production, Mathews and Huang exaggerate its importance by claiming that “Without China’s shift to renewables. . . China would be facing extreme energy insecurity” (2018, p. 14).
This is mistaken. Vast excess capacity could allow thermal power plants to replace the entire output of China’s wind and solar farms (and virtually all of China’s hydropower as well). China’s thermal power fleet averaged 4,209 operating hours during 2017, far below historical norms (Electricity Summary 2017). The average of annual operating hours for thermal power plants during 2005-2011 was 5,271 hours, or 25 percent above the 2017 figure (Zhang 2014, p. 48).
Had China’s thermal fleet increased 2017 operating hours and production by 25 percent, thermal power output would have risen by 1.14 trillion kilowatt hours from the actual figure of 4.55 trillion. This far exceeds the combined 2017 total of 0.423 trillion kilowatt-hours generated by wind and solar facilities (2017 output totals from Mathews and Huang 2018, Table 1).
To do this would require more coal.14 The National Bureau of Statistics (NBS) online balance table for coal shows that power plants consumed 1.79 billion tonnes of coal in 2015. Thermal power output amounted to 4.28 trillion kilowatt hours in 2015 (NBS website) and 4.55 trillion (Matthews and Huang 2018, Table 1), or 6.3 percent more, in 2017. We can approximate 2017 coal consumption for thermal power use at 1.79 * 1.063 = 1.90 billion tonnes.
Using coal to increase 2017 thermal power production by 25 percent would call for an additional 1.90 * 0.25 = 0.48 billion tonnes of coal.
Peak coal production in 2013 reached 3.97 billion tonnes, or 0.52 billion tonnes above the 2017 figure of 3.45 billion tonnes provided by Mathews and Huang. Reversing recent policies that have shut some coalmines and limited many others to 280 annual working days could easily provide the coal needed to replace 100 percent of China’s wind and solar power output.
Despite its environmental consequences, replacing China’s entire output of wind and solar electricity with thermal power is surely feasible. Such a shift would require neither added coal imports nor construction of new power plants.
Generating electricity from wind and sunshine has ample merits, but staving off “extreme energy insecurity” is not among them.
3. Critics note a wide gap between current Chinese policies and official statements promising a “dominant role” to market forces. Electricity is one industry in which we see a marked advance of market influence. Chinese sources report that market-mediated electricity sales amounted to 18.9 and 25.9 percent of total 2016 and 2017 power consumption respectively (Electricity Summary 2017; Lu Bin 2018), with further increases anticipated for 2018 and beyond. Under these circumstances, it is surprising to note the conspicuous absence of the term “price” in the Mathews-Huang paper.
The authors ask, “What is driving China’s green shift?” The progress of market-leaning electricity reform suggests a wider question: “What is driving structural change in China’s energy economy?” Declining retail electricity prices, especially for industrial users (who absorb close to 70 percent of total power output – see Electricity Summary 2017) are one such driver. Falling retail prices (with policy-makers promising additional future reductions) subject electricity producers to enormous financial pressures. Costs for wind and solar producers are falling, but remain high. Escalating safety requirements banish the possibility of cost reductions in the nuclear sector. Opportunities for cost reduction cluster in the thermal power sector. As a result, market pressures arising from declining prices and costs may spark a rebound in sales of thermal power, and thus in the derived demand for thermal coal, an outcome at odds with Beijing’s environmental objectives and also with the expectations of Mathews and Huang.
Thomas G. Rawski
Emeritus Professor of Economics
University of Pittsburgh
May 6, 2018
References
Electricity Report. 2017. 中电联发布《2017-2018年度全国电力供需形势分析预测报告》[China Electricity Council issues “2017-2018 Analysis and Forecast Report on Electricity Supply and Demand”]. Accessed February 7, 2018 from.
Electricity Summary 2017. 2017年全国电力工业统计快报一览表 [2017 National Electricity Industry Statistical Summary Table]. Accessed April 3, 2018.
Lu Bin卢彬. 2018. 电力行业三年“让利”近7000亿 [Three-year electricity reform ‘dividend’ approaches RMB 700 billion]. 中国能源报 [China Energy Report]. April 16, p. 2.
Zhang Weirong 张维荣 . 2016. 中国火电产业发展概论 [Introduction to the development of China’s thermal power industry]. Beijing: China Electric Power Press.
Response to Professor Rawski
John A. Mathews and Xin Huang
We are grateful to Professor Thomas Rawski for his comments on our article. We recognize him as a distinguished scholar of China’s industrial development and co-author of a definitive study of China’s economic boom, published in the Journal of Economic Literature in 2014.15
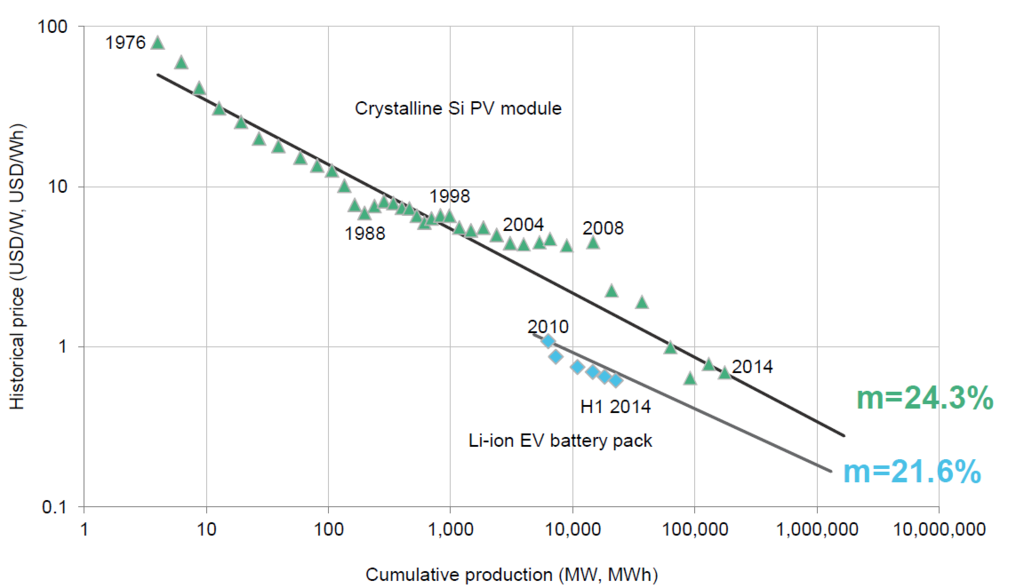
Taking his points in reverse order, we agree with his point (3) that we have neglected the price issue in our article, and accept his comments on this topic. Of course, prices in the electric power sector are subject to price guides issued by the National Development and Reform Commission (ND&RC), which local provincial governments are expected to comply with, subject to some local adjustment. Proposals and analyses calling for a more market-oriented price-setting mechanism have attracted wide attention in China, along with further debate over 5-year planning horizons. But our major point in favor of the green shift, namely that costs of solar and wind power are falling as equipment costs fall as a result of the learning curve, remains valid – and so we disagree that “costs (for wind and solar) remain high.” Consider the chart on global cost reductions for solar PV (1976-2014), demonstrating that for every doubling of production the cost for solar has fallen by 24.3% — driven largely by cost reduction in China.
|
Source: BNEF |
On Professor Rawski’s second point, we maintain that our argument concerning China’s energy insecurity being made worse by fossil fuel imports is valid. Professor Rawski introduces an argument based on China’s excess capacity and speculates that its lower capacity efficiencies could allow it to raise its thermal power output by up to 25%. But why speculate in such a manner when it is abundantly clear that the Chinese authorities are doing all in their power to reduce fossil fuel dependence and curb coal burning? Professor Rawski speculates that thermal power production could be increased by 25%, calling for additional 0.48 billion tonnes of coal – an increase that flies directly in the face of repeated efforts in recent years to reduce coal consumption. Speculating as to whether China might replace its entire green electricity output with added thermal power seems to us to be ill-advised. We are working on a fresh study that will demonstrate how recent increases in fossil fuel imports have worsened China’s energy security, while generation of green power has moderated this worsening dependence.
On the first point we acknowledge that Professor Rawski has studied the Chinese coal imports data carefully, and that coal imports have indeed been falling (subject to a reversal in 2017). This is a welcome trend, consistent with our argument that China is making supreme efforts to reduce its dependence on fossil fuels, with greening of the electric power sector as a major tool in this policy armory.
John A. Mathews and Xin Huang
May 7, 2018
Notes
See Amy Myers Jaffe 2018. Green Giant: Renewable energy and Chinese power, Foreign Affairs (March-April 2018).
See J. Mathews, ‘China’s electric power: Results for First Half 2017 demonstrate continuing green shift’, Sep 15 2017, Asia-Pacific Journal, or JM, ‘The green growth economy as an engine of development: The case of China’.
“China’s greening of its energy system outpaces its further blackening: A 2017 update.” The Asia-Pacific Journal.
A recent article by Dan Murtagh, drawing on data provide by the International Energy Association, “China Is Over Coal, Bored With Oil as it Charts Green Future,” provides an extreme version of the view that China has essentially solved its black energy problem Nov 14, 2017.
Hao Tan, “A Global Industry Rebalance: China and Energy Intensive Manufacturing,” The Asia-Pacific Journal, May 1, 2018.
Ana Swanson, “How China Used more cement in 3 years than the U.S. did in the entire 20th century,” Washington Post, March 24, 2015; see also David Owen, “The End of Sand,” New Yorker, May 29, 2017, 28-33.
See for example Asian Infrastructure Investment Bank, Latest News. China with $29.8 billion provided 31% of the investment capital. The Belt and Road Initiative, while focusing on the countries of the silk road, like the AIIB, is also global in scope with 72 nation participants in April 2017. . . including many US allies but not the US. See HKTDC Research for participating countries; Alexandra Ma, “Inside ‘Belt and Road’, China’s Mega-project that is linking 70 countries across Asia, Europe and Africa,” Business Insider, Jan. 31, 2018.
What follows assumes that thermal power plants burn only coal. In reality, 2017 thermal power capacity was 110.6 million KW (Electricity Summary 2017), of which coal-burning plants accounted for 103.6 million KW or 93.7 percent (Electricity Report 2017). Adjustments reflecting this complication would not alter the conclusion that excess thermal generating capacity could easily replace China’s entire 2017 output of wind and solar power.
Brandt, L., Ma, D. and Rawski, T.G. 2014. From divergence to convergence: Reevaluating the history behind China’s economic boom, Journal of Economic Literature, 52 (1): 45-123.


