Abstract: The DPRK is said to be an economist’s nightmare. There are almost no reliable statistics available, making any analysis speculative at best. The few useable figures that we have, though, fly in the face of the media’s curious insistence on a looming collapse. Food production and trade volumes indicate that the DPRK has largely recovered from the economic catastrophe of the 1990s. Indeed, Pyongyang’s reported rising budget figures appear more plausible than Seoul’s pessimistic politicized estimates. Obviously, sanctions, while damaging, have failed to nail the country down. There are signs that it is now beginning to open up and prepare to exploit its substantial mineral wealth. Could we soon be witnessing the rise of Asia’s next economic tiger?
Keywords: Economy of DPRK/North Korea, inter-Korean and Sino-Korean trade, effectiveness of sanctions, Bank of Korea estimates, Iron Silk Road
There is hardly an economy in the world that is as little understood as the economy of the Democractic People’s Republic of Korea (aka “North Korea”). Comprehensive government statistics have not been made public since the 1960s. Even if production figures were available, the non-convertibility of the domestic currency and the distortion of commodity prices in the DPRK’s planned economy would still prevent us from computing something as basic as a GDP or GDP growth figure1. In the end, this dearth of public or useable primary data means that outside analysis is generally based more on speculation or politicized conslusions than on actual information. Unfortunately, the greater the province of speculation, the greater also the possibility of distortion, and hence of misinformation, or even disinformation.
The dominant narrative in the Western press is that the DPRK is on the verge of collapse2. What commentators lack in hard data to prove this, they often try to invent. There is no way, it is suggested, that the economy could ever recover on its own from the combined economic, financial and energy crisis that hit it in the 1990s3. And indeed, though it remains difficult to quantify the damage done by the collapse of the Soviet Union, we know that the DPRK was then suddenly confronted with the loss of important export markets and a crippling reduction of fuel and gas imports. These two factors triggered a cataclysmic chain reaction that severely dislocated the Korean economy.
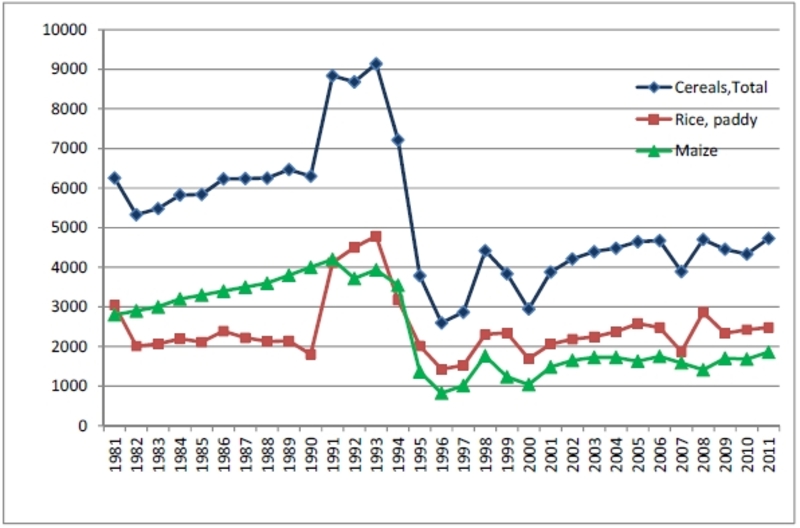
Perhaps the most dramatic aspect of the disaster was the collapse of food production. The sudden shortages of fuel, fertilizer and machinery, compounded by “a series of severe natural disasters” from 1995 to 19974, made the DPRK tumble from a self-reported food surplus in the 1980s to a severe food crisis in the 1990s. We will address the reliability of food figures in greater detail below, but suffice for now to say that figures provided to the Food and Agricultural Organization’s (FAO’s) investigative team indicate production dipping from “a plateau of 6 million tons” of grain equivalent from 1985 to 1990to about 3.5 million tons in 1995 and less than 3 million in 1996 and 19975. Food requirements for the roughly 23 million-strong population were almost 5 million tons6. The chain of events left the DPRK no choice but to make a formal appeal for aid to the international community in August 1995.
|
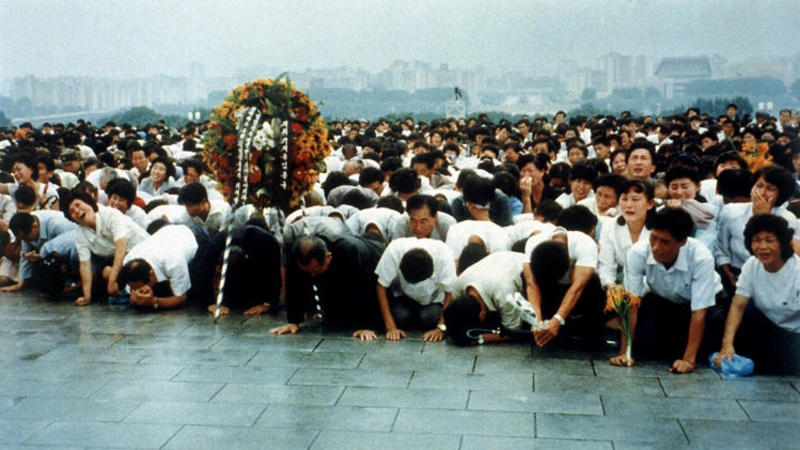
Illustrating the crisis, President Kim Il-Sung passed away on July 8th, 1994. Official images of grieving citizens. The country observed a three-year mourning period before Kim Jong-Il assumed the leadership in 1997. Photo: Korean Central News Agency (KCNA) |
A barrage of sanctions also seriously disrupted and continues to disrupt the DPRK’s ability to conduct international trade, making it even more difficult for the country to get back on its feet. Besides the unilateral sanctions regimes that the US and its allies have put in place since the early days of the Cold War7, the country also has had to face a series of multilateral sanctions imposed by UN Security Council resolutions in 2006 (S/RES/1718/2006), 2009 (S/RES/1874/2009) and 2013 (S/RES/2087/2013). The bulk of these are financial and trade sanctions, as well as travel bans for targeted officials.
Financial sanctions curtail access to the global financial system by targeting entities or individuals engaging in certain prohibited transactions with or for the DPRK. The professed intention is to prevent specific transactions from taking place, particularly those related to the DPRK’s nuclear weapons program, or alleged money-laundering activities. In practice, however, the stakes of even a false alarm can be so high that banks might well shun even the most innocuous transactions with the DPRK. In the Banco Delta Asia (BDA) affair, for instance, public suspicion by the US Treasury that a Macanese bank might be money-laundering and distributing counterfeit dollars for the DPRK destroyed the bank’s reputation and triggered a massive bank run even before local authorities could launch a proper investigation8. An independent audit commissioned by the Macanese government from Ernst & Young found the bank to be clean of any major violations9, but the US Treasury nonetheless blacklisted BDA in 2007, triggering suspicions that it was simply trying to make an example of the bank10. Whatever the case, the blacklisting effectively prevented BDA from conducting transactions in US dollars or maintaining ties with US entities, and caused two dozen banks (including institutions in China, Japan, Mongolia, Vietnam and Singapore) to sever ties with the DPRK for fear of suffering a similar fate11. Veiled threats by the US Treasury also seem to be behind the Bank of China’s closure in 2013 of the DPRK Foreign Trade Bank’s account12, and possibly had an indirect influence on other major Chinese banks’ cessation of all cross-border cash transfers with the DPRK (regardless of the nature of the business)13. As we can see, financial sanctions effectively contribute to making the DPRK an “untouchable” in the world of money, greatly affecting its ability to earn foreign currency by conducting legitimate international trade or attracting foreign direct investment. Obviously, shortages of such foreign currency have grave developmental consequences, because they limit vital and urgently needed imports of fuel, food, machinery, medicine, and so on, “stunting” both the economy and the general population14.
Trade sanctions also have a more disruptive effect than their wording suggests. Although the sanctions were ostensibly designed to prevent DPRK imports of nuclear, missile or weapons-related goods and technology, in practice they had the effect of blocking DPRK imports of a whole range of goods and technology that are classified as “dual-use,” which means that their civilian use could potentially be adapted for military purposes. The result is that the “dual-use” lists prohibit imports of equipment, machinery and materials that are in practice essential for the development of a modern economy, impeding the development of a broad range of industries such as aeronautics, telecommunications as well as the chemical and IT sectors15. In his book “A Capitalist in North Korea,” Swiss businessman Felix Abt explained, for instance, how a $20 million project to renew Pyongyang’s water supply and drainage system fell through, simply because the Kuwaiti investor was concerned that importing the software needed for the project could run afoul of US dual-use sanctions against the DPRK16. Abt further recalls the role UN sanctions played in preventing his pharmaceutical company from importing the chemicals it needed for a healthcare project in the DPRK countryside17.
Given the formidable obstacles, the international press has drawn the conclusion (1) that the DPRK is one of the poorest countries in the world18. But it has also concluded (2) that its misery is almost entirely the result of systematic mismanagement19, and (3) that it will go from bad to worse as long as it refuses to implement liberal reforms20. Yet, these assertions, which have been repeated throughout the period of six decades of sanctions, are rarely supported by hard data. On the contrary, they run counter to the little reliable evidence available.
The “Black Hole”
If statistics on the DPRK economy are mentioned at all in the Western press, they generally stem from “secondary source” estimations rather than “primary source” figures from the DPRK government. The most commonly used of those estimates are those of the South Korean Bank of Korea (BOK) and of the US Central Intelligence Agency (CIA)21. Yet there are a number of reasons why these numbers in fact are nearly unuseable as evidence for the above three claims.
First, the numbers are equivocal. CIA numbers do present the DPRK as comparatively poor in terms of PPP-based GDP per capita. The $1800 figure from 2011 would place it 197th of 229 countries in the world, located among mostly African economies22. But as far as the CIA’s general GDP figure goes, the $40 billion figure catapults the economy into a comfortable middle position (106thof 229)23, which is not really what one would expect from “one of the poorest countries in the world.” Moreover, neither BOK nor CIA figures demonstrate that the DPRK economy is going “from bad to worse.”The CIA’s PPP figure has simply remained stuck at $40 billion for the past ten years. And according to BOK estimates, the DPRK’s GDP has been growing at an average of roughly 1% per year in the ten years from 2003 to 201224. These figures alone cannot prove recession, they would have to be combined with evidence of high inflation rates. This, again, is easier said than done, in the absence of access to something like a yearly and holistic consumer price index (CPI) figure.
|
1997 |
1998 |
1999 |
2000 |
2001 |
2002 |
2003 |
2004 |
|
-6.3 |
-1.1 |
6.2 |
1.3 (0.4) |
3.7 (3.8) |
1.2 |
1.8 |
2.2 (2.1) |
|
2005 |
2006 |
2007 |
2008 |
2009 |
2010 |
2011 |
2012 |
|
3.8 |
-1.1 (-1.0) |
-2.3 (-1.2) |
3.7 (3.1) |
-0.9 |
-0.5 |
0.8 |
1.3 |
Figure 1: BOK estimates of DPRK GDP growth 1997-2012
Note: Figures up to 2008 are drawn from the BOK report for 2008, and those from 2009 to 2012 are drawn from the report for 2012. Figures in parentheses represent those from the 2012 report that conflict with those from the 2008 report25.
Second, these numbers are rarely comparable with figures for other countries, for methodological reasons. Both institutions admit this, and yet many commentators seem to ignore it when they use them. The BOK’S GDP estimates, for instance, are unsuitable for international comparison with any economy except the South Korean one, because they were estimated on the basis of South Korean prices, exchange rates and value added ratios26. Meanwhile, CIA estimates are unsuitable for historical comparison, because the methodology it used changed over time27. Particularly striking is the sudden and unexplained “jump” from a $22.3 billion GDP figure in 2003 to a $40 billion one in 200428.
Third, these numbers are actually little more than wild guesses. Both institutions admit that they have far too little data to work with to provide reliable estimates. BOK officials, for instance, have conceded that the paucity and unreliability of price and exchange rate data for North Korea mean that an estimated GDP figure will “by nature be highly subjective, arbitrary and prone to errors.”29 The CIA, for its part, rounds PPP-based GDP figures for the DPRK to “the nearest $10 billion,” telling volumes about the confidence with which it makes its estimates30.
Four, these numbers cannot accurately reflect fundamental differences between market-driven and socialist economies. How meaningful or useful are the GDP per capita figures of the CIA and the BOK in measuring quality of life in a taxfree country with public food distribution as well as free housing, healthcare and education? What do prices or income really mean in such a system anyway? The use of GDP figures is notoriously controversial when it comes to judging the well-being or economic development of a people, and this is even truer in the case of socialist economies31.
|
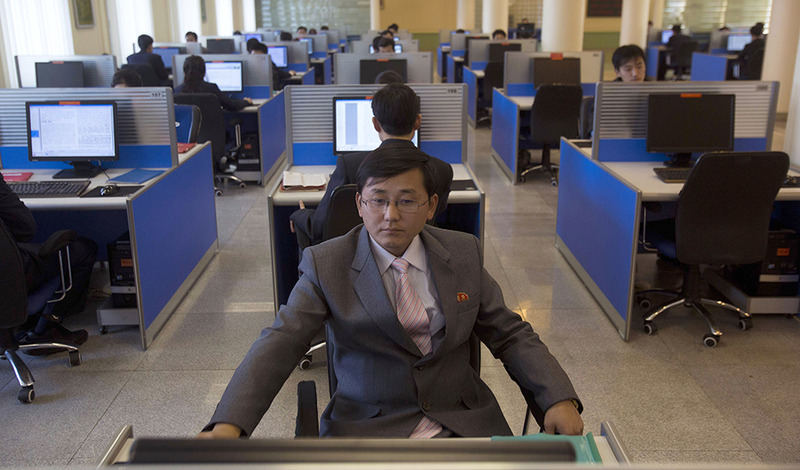
Illustration 2: A student working in a computer lab at Kim Il-Sung University, Pyongyang, on January 8, 2013. The DPRK literacy rate is one of the highest in the world (100% according to the CIA Factbook, 2008 est.). Photo: David Guttenfelder / AP Photo. |
Finally, there are good reasons to think that the numbers have been politically manipulated.According to Marcus Noland, executive vice-president and director of studies at the Peterson Institute for International Economics:
[The BOK’s GDP estimation] process is not particularly transparent and appears vulnerable to politicization. In 2000, the central bank delayed the announcement of the estimate until one week before the historic summit between South Korean President Kim Dae-jung and North Korean leader Kim Jong Il. The figures implied an extraordinary acceleration of North Korea’s growth rate to nearly 7 percent. This had never occurred before and has not been repeated since. Under current South Korean President Lee Myung-bak, a conservative, the central bank’s figures imply that the North Korean economy has barely grown at all32.As for the CIA numbers, suffice to say that they create a completely artificial impression of stagnation by systematically rounding the GDP figure to the nearest $10 billion33.
As we can see, there are very serious grounds to doubt the reliability of secondary source estimates. This is why Noland has called the DPRK’s economy a “black hole” and warned against trusting any figure on DPRK economy that comes with a decimal point attached34. Rüdiger Frank, economist and Head of the Department of East Asian Studies at the University of Vienna, concurs:
Too often, such numbers produced by Seoul’s Bank of Korea or published in the CIA World Factbook seem to be a curious product of the market mechanism. Where there is a demand, eventually there will be a supply: if you keep asking for numbers, they will eventually be produced. But knowing how hard it is to come up with reliable statistics even in an advanced, transparent, Western-style economy, it remains a mystery to me how suspiciously precise data are collected on an economy that has no convertible currency and that treats even the smallest piece of information as a state secret35.
Obviously, this does not leave us with many reliable sources of information to appreciate the state of the DPRK economy.
Of Food and Trade
The rare useable statistics indicate that the DPRK has, against all odds and expectations, managed to get back on its feet, and is now poised to reach new heights. As we will see, food production appears to have nearly recovered to self-sufficiency, which should bring increased labor productivity and life expectancy. Trade, for its part, seems to be booming, easing access to much-needed imports and foreign currency.
Food production is one of a few areas for which decent statistics are publicly available. When the DPRK first called for food aid in the 1990s, it agreed to cooperate with inspectors from the Food and Agriculture Organization (FAO) and the World Food Programme (WFP) in drafting an annual report for the donor community, the “Crop and Food Security Assessment Report” (CFSAR). There is a growing consensus that this cooperation makes the CFSAR a reasonably solid estimate of food production in the DPRK. According to Randall Ireson, consultant on rural and agricultural development issues in Asia:
Like all reports on North Korea, theCFSARsare by no means perfect, but we have come a long way from the 1990s when for most reports, any precision after the first digit represented a wild guess. While there are certainly errors in the estimates, the reports have benefited from the use of a consistent methodology over many years and improved cooperation from DPRK authorities. Moreover, since 2011, the assessment teams have included international Korean-speaking members, and since last year, they have been able to take sample crop cuttings from selected fields as a cross check against farm production reports. […] The mission used official data provided by the government, but adjusted those data based on ground observations and satellite information36.
|
Figure 2: DPRK Cereal Production 1981-2011 (per thousand metric tonnes). Source: FAO37. |
According to the latest CFSAR, the food production for the year 2012 to 2013 was 5.07 mMT of grain equivalent. This corresponds to 95% of the estimated grain requirement of the DPRK for that year38. Note that this figure does not mean malnutrition has been fully eradicated, especially among vulnerable groups. The estimate refers solely to an average grain requirement of 1640 kcal/day per person (174 kg of grain equivalent per year), excluding 400 kcal/day and other nutrient needs (e.g. protein) to be covered with non-cereal food sources39. Moreover, the figure does not address the issue of distribution. But even though these are important caveats, seeing self-sufficiency within grasp remains a major cause of optimism, especially when the current 5.07 mMT figure is compared to the 3 mMT of the late 1990s. Provided that appropriate reforms are made and effectively implemented, it may be only a matter of time before the DPRK returns to the 6 million tons plateau it reported for the late 1980s.
Trade is another area for which comparativelysolidstatistics now exist. Although the DPRK does not publish its trade volumes, data can still be collected through reverse statistics of its trade partners40. The reliability of an aggregated trade volume figure for the DPRK is thus dependent on the countries for which data have been collected. Unfortunately, it appears that customs offices sometimes make major errors, for example by confusing trade with Pyongyang and trade with Seoul41. Reliability thus also depends to a certain extent on the good judgment of the database compilers, especially since many statistics are likely to be simply mirrored from other sources. Finally, it must be kept in mind that sanctions on the DPRK might force it to conduct a substantial part of its trade covertly42, and that a considerable amount of smuggling might be conducted outside the purview of the State, meaning that officially reported trade figures are actually heavily undervalued compared to the real amount of trade conducted by DPRK entities and individuals.
According to an extensive review of DPRK economic statistics by development consultant Mika Marumoto, the most referenced databases on DPRK trade volumes are those of the IMF Direction of Trade, the UN Comtrade and the Korea Trade and Investment Promotion Agency (KOTRA), a South Korean organization43. There are still important differences between the respective figures they report for the DPRK. In 2006, says Marumoto, the aggregate trade volume figures varied from $2.9 billion for the KOTRA, to $4.3 billion for the IMF and to $4.4 billion for the UN database44. According to Marumoto, the discrepancy is largely explainable by differences in the number of countries covered and the conservativeness with which the data is appraised. From 1997 to 2007, the KOTRA surveyed trade with only 50 to 60 countries, while the IMF and the UN covered dealings with 111 to 136 countries45. KOTRA tends to be much more critical than the IMF and the UN concerning figures reported by national customs offices, often preferring to ignore them rather than run the risk of including errors46. The result, according to Marumoto, is that while IMF and UN figures may be overvalued for recording certain erroneous figures, the KOTRA data are almost certainly overly conservative, for example by ignoring trade with the entire South American continent47. Despite all those caveats and differences, the trade data nonetheless remain useful in providing a certain sense of scale.
Another major methodological issue that deserves attention is that Seoul does not report trade with Pyongyang as “international trade48.” In the complex politics of a divided nation, neither the southern nor the northern government considers the other another “country.” They record trade with each other in a separate, “inter-Korean” trade category. The statistics of international organizations like the IMF and UN cannot reflect these subtleties, and thus simply record that inter-Korean trade is extremely low (e.g. $36 million in 2005) or even non-existent, when Seoul is in fact Pyongyang’s second-most important trade partner after Beijing, with volumes standing at about $1.8 billion in 200749. Since KOTRA does not include inter-Korean trade volumes, and since the IMF and UN numbers are unusable for this, we have to use the separate data of the southern Ministry of Unification (MOU). Unfortunately, what the MOU counts as “trade” includes transactions that are in fact classified as “non-commercial” and that includegoods related to humanitarianaid,as well associal and cultural cooperation projects50.Moreover, the trade figures may be further inflated by the way in which the MOU records transit of goods in and out of the Kaesong Industrial Complex (KIC), a joint economic zone in the North that accounts for the bulk of inter-Korean trade. By counting “southern” KIC inputs as exports and “northern” KIC outputs as imports, the MOU is actually deviating from standard accounting practice, insofar as it should only be counting as imports the value added by processing in the KIC. Both of these points suggest that the MOU numbers are overvalued, but we simply have no alternative ones to use.
|
Figure 3: KOTRA and IMF DOTS presentations of the ratio of Sino-Korean trade to total DPRK trade 1990-2010. Graph by Stephan Haggard and Marcus Noland51. |
For the sake of simplicity, rather than quote a multitude of sources every time for international trade figures, we will simply use the KOTRA numbers for international trade in tandem with the MOU numbers for inter-Korean trade (except where otherwise specified), bearing in mind that they are respectively under- and over-valued. Southern research databases like the Information System for Resources on North Korea (i-RENK) generally followthese figures and compile their graphs accordingly52. Both KOTRA and the MOU are, after all, South Korean governmental organizations.
According to i-RENK, the great majority of DPRK trade is conducted between the Koreas ($1.97billionin 2012) and with China ($5.93billionin 2012).Trade with the rest of the world was evaluated by KOTRA at around $427 million in 2012, from which tradewith theEuropean Unionaccounted forabout $100 million,according to the EU’s Directorate-General for Trade53. According to the CIA Factbook, the DPRK primarily imports petroleum, coking coal, machinery and equipment, textiles and grain;it exports minerals, metallurgical products, manufactures (including armaments), textiles, agricultural and fishery products54.Interestingly, even ROKfigures clearly indicate that the DPRK is going through an unexpected trade boom, beginning, of course, from low levels of trade. AggregateKOTRAand MOU figures indicate thatthe total volumes have nearly quintupled from $1.8 billion in 1999 to $8.8 billion in 201255.This directly contradicts suggestions that theDPRKis going “from bad to worse.”
A further observation that can be made is that Pyongyang is much less dependent on inter-Korean trade as a source of foreign currency than Seoul apparently believed. It is probable that the KOTRA methodology contributed to create this false impression as its statistics systematically ignore most of the developing world. At any rate, when hawkish conservatives came to power in Seoul in 2008, they decided to pressure Pyongyang by using inter-Korean trade as a carrot to control it . This strategy turned out to be grossly miscalculated. Pyongyang simply turned to Beijing, and trade volumes with China soon left those with South Korea far behind. Instead of increasing Seoul’s influence in Pyongyang, the confrontational move drastically reduced it, wasting a decade of trust-building efforts by South Korean doves.
The evolution of Sino-Korean (China-DPRK) and inter-Korean trade clearly reflects the shifting of Pyongyang’s priorities and possibilities. Back in 1999, trade levels were still similar –i-RENK graphs show the inter-Korean trade at$333millionand the Sino-Korean at$351million. Thanks to the doves’ efforts in Seoul, both trade channels progressed at roughly the same speed for the next eight years, reaching respectively $1.8and $2billion in 2007. But when the hawks took over and tried to take inter-Korean trade hostage, total volumes stagnated at an average of $1.8 billionfor four years, even falling to $1.14billion in 2013, their lowest level since 200556. The politicization of inter-Korean trade by Seoul predictably led to a shift towards Beijing, and Sino-Korean trade volumes soared up to six times ($6.54billion57in 2013) above inter-Korean ones. “South Korea,” as one commentator bluntly concludes, “has lost the North to China58.” Tokyo similarly wasted its influence when it first banned all imports from the DPRK and then all exports to it to express its displeasure with Pyongyang’s nuclear tests in 2006 and 200959. The DPRK is left with nothing else to lose, and has continued its nuclear tests in 2013 regardless of Japan’s now almost toothless protests.
|
Figure 4: Inter -Korean and Sino-Korean trade volumes 1993-2011. Graph by Scott A. Snyder60. |
Budget Matters
Having established that the DPRK is probably close to food self-sufficiency and is experiencing a trade boom, we can consider primary sources from the DPRK itself, such as the annual budget sheets published by the Supreme People’s Assembly (SPA). They are the closest we get to official and publicly available statistics on the DPRK economy. Remarkably, the latest ones hint that the DPRK has attained or is about to attain double digit growth. If that proves to be correct, the change would be extraordinary, given what the DPRK went through in the 1990s and continued obstacles such as US-led sanctions.
Before drawing any conclusions, however, we must examine the reliability of those numbers, as we did for our other sources. Critics point out that the published sheets are full of blanks, and only reveal relative rather than absolute numbers61. Moreover, the achievements cannot be verified, leading to accusations that the projections may be little more than Party propaganda. But according to Rüdiger Frank, who has lived in both the GDR (the former East Germany) and the Soviet Union before the end of the Cold War, there are good reasons to see these figures as “not just propaganda, but rather more or less the North Korean contribution to the guessing game about [the performance of the country’s economy62.”
Though Frank cautions against taking the figures at face value, he points out that they do consistently include overall values for State revenue and expenditure – both planned and achieved. He argues that this can, at the very least, reveal the level of optimism and confidence the authorities place in the economy63. His analysis of the year-on-year differences since the early 2000s shows that this level, rather than following an “idealized” trajectory, shows credible patterns of response to major contemporary events64. There are, for instance, significant drops and priority shifts in reaction to the Iraq War or the DPRK’s first nuclear test in 2006. Interestingly, Frank notes a “relatively high” coefficient of correlation of the SPA budget figures with the BOK’s GDP growth estimates of the DPRK, leading him to conclude that “although both sides seem to differ about the amount of growth, at least there is some moderately strong agreement about its general direction65.”
|
Figure 5: Year-on-year growth (in percentage) according to BOK estimates on GDP and SPA reports on state budget revenue and expenditure. Source: BOK, KCNA. Graph by Rüdiger Frank66. |
The year-on-year growth of the state budgetary revenue stands out for our purposes, because one can assume it loosely corresponds to a GDP growth figure. We can see, for instance, that the growth of achieved revenue drops sharply from +16% in 2005 to a little over +4% in 2006 – perhaps because of the sanctions for the first nuclear test. Although direct comparisons between SPA and BOK data should actually be avoided insofar as they do not measure exactly the same sort of growth, it is still notable that the BOK numbers also report a sharp drop from +3.8% in 2005 to -1.0% in 2006.
Interestingly, however, the two trajectories diverge after this. BOK values from 2008 (+3.1%) to 2012 estimate a dip in 2009 (-0.9%) and a timid recovery up until 2012 (+1.3%). SPA values, however, accelerate by almost a full percentage point per year from 2008 (+6%) to 2013 (+10.1%). Why does the BOK estimate growth to be so weak and erratic when the SPA reports it to be so strong and sustained? There seems to be a world of a difference between the southern narrative of near stagnation and the northern picture of double-digit growth. Of course, we should not get too caught up in the detail of numbers that are little more than wild guesses on the one side and that are unverifiable on the other. But analysing the credibility of each version may give us useful hints on the DPRK’s actual rate of growth.
The 2009 Mystery
Consider 2009, when the BOK estimated a sharp dip (from +3.1% to -0.9%) and the SPA presented steadily accelerating growth (from +6% to +7%). There are a number of major events that could help us determine which of these trajectories is most plausible.
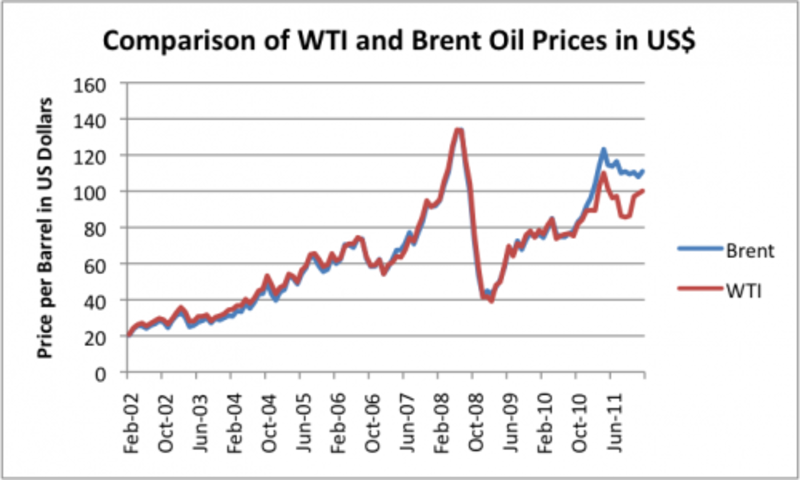
First of all, oil and food prices fell markedly on the world market that year, following the financial crisis. The price of Brent crude oil nose-dived from nearly $140 per barrel in 2008 to about $40-80 in 2009, and the FAO food price index fell down from 201.4 points in 2008 to 160.3 in 200967, making imports of both much more affordable for the DPRK.
|
Figure 6: WTI and Brent crude oil prices 2002-2011 |
Second, trade and financial sanctions against the DPRK were tightened by Security Council Resolution 1874 on June 12, in response to a new nuclear test by the DPRK. However, there was not much more that could be tightened after the 2006 sanctions, besides lengthening the lists of embargoed arms, luxury goods and dual-use items as well as targeting eight entities and five officials with financial sanctions and travel bans.
Third, meteorological stations recorded “unusually intense rainstorms” in August to September 2009 and an “unusually severe and prolonged68” winter for 2009/2010, affecting the country’s agriculture. Unfortunately, the FAO did not draw up an annual report for crop and food security assessment (CFSAR) in 2009, leaving us to rely on information collected for the 2010 CFSAR.
Fourth, a major currency revaluation came into force on the 30thNovember 2009, when citizens were given a certain time window to exchange old currency for new currency at a rate of 100:1, with an exchange cap eventually set at 500,000 oldwon69. Remaining oldwonwere to be deposited in a state bank, but deposits in excess of a million were to come with proof of a legal source of earning70. This was meant to multiply the spending power of ordinary citizens (wages in newwoncoupled with price controls in the public distribution system) while wiping out the stashes of thenouveaux richeswho had been involved in the shadow economy and who could not prove a legal source of earning, like smugglers and corrupt officials71. On a macroeconomic level, it would allow the state to reassert control over the currency (curb inflation and reduce currency substitution) and over the economy (discourage imports, stimulate domestic production and replenish bank capital available for investment)72 Outside observers, however, feared that the blow to private savings and the shadow economy could dislocate the main economy and lead to a devastating food crisis, as much food consumption was reportedly drawn from private markets73. Last but not least, it must be noted that the publication of the BOK estimates for the DPRK’s GDP growth in 2009 were published just a month after hawks in Seoul called a halt to all inter-Korean trade and investment outside of a designated special economic zone, the Kaesong Industrial Complex. As we will see below, there are reasonable grounds to believe that those estimates have been affected by the drama of domestic politics unfolding at the time.
So, how is possible to justify negative economic growth based on those events? From the BOK perspective, the 2009 dip is due to “decreased agricultural production due to damage from particularly severe cold weather” and “sluggish manufacturing production owing to a lack of raw materials and electricity74.” Accordingly, the agriculture, forestry & fisheries sectorand the manufacturing sector were said to be down by respectively -1 and -3%, compared with 2008. Based on satellite images, the BOK estimated cereal production to have slowed from 4.3 million metric tons of grain equivalent in 200875to 4.1 mMT in 200976. Lack of raw materials and electricity, for its part, could be explained by the difficulty of securing imports because of tightening sanctions and because of the depreciation of thewoncompared to other currencies in the wake of the reform. The revaluation was also reported in the Western and South Korean press to have wreaked havoc in the economy, as the crackdown on smugglers and private traders reduced the supply of a range of goods and thereby allegedly triggered “runaway inflation77.”
That being said, there are reasonable grounds to challenge this pessimistic analysis. Concerning the agricultural sector, there are obviously limits to the accuracy of satellite-based estimates. The slashing of oil prices on the world market would instead suggest a rise in agricultural production, given the greater affordability of fuel and fertilizer. And while the FAO confirms harsh weather reports and appears to report figures similar to those of the BOK78, the fact that it did not draw up a separate report for 2009 indicates that it did not enter the country that year, and that it might therefore just be mirroring BOK estimates. This means that, once more, we are confronted with unverifiable figures. Concerning access to imports, it is hard to imagine the 2009 sanctions could have seriously hurt the economy, given that the country had by this time found a range of ways to evade these sanctions79and there was not much more to tighten compared to 2006. Instead, again, the tumbling of food and oil prices on the world market suggests that the DPRK’s two most crucial imports could be secured at more affordable prices, allowing the redirecting of reserves for other needed imports.
As for the currency revaluation, the surprise announcement arguably came too late (30thNovember) to have seriously impacted 2009 figures on the general economy.The reform did suffer some problems of implementation, as the government publicly admitted80, butWestern claims of chaos and unrest (or even of the sacking and execution of a responsible official) were based on second- or third-hand reports of isolated, unverifiable or uncorroborated incidents81. Note also that the above-mentioned “runaway inflation” reports are not based on holistic CPI figures, but on foreseeable price hikes of selected consumer itemson the black market(making it unattractivevis-à-visthe public distribution system was the whole point, after all). Western beliefs that the shadow economy was so big that any attack on it would dislocate the main economy appear to have been proved wrong in retrospect asprices and exchange rates stabilized after a short period of transition82. Keeping in mind that, in all likelihood, the reform partly aimed at freeing up capital and stimulating domestic production, we would have to compare nationwide production figures in all sectors before and after the reform to establish whether it actually had a positive or negative impact on the main economy. Since we don’t have these figures, we cannot really pass a verdict on the reform’s legacy. But note that according to Jin Meihua, a research scholar on Northeast Asian Studies at the Jilin Academy of Social Sciences writing thirteen months after the revaluation, exchange rates with the Chinese yuan, prices of rationed rice and prices of rice on the open market all more or less halved from 2009 to 2010, dropping respectively from 1:500 to 1:200, from 46 to 24 won a kg, and from 2000 to 900 won a kg83. These figures imply that the turbulent period that followed the reform did not last long, and that prices and exchange rates soon stabilized enough to double the spending power of consumers of rice and Chinese imports. At the end of the day, it does seem hard to use this reform to build a convincing case for GDP drop.
|
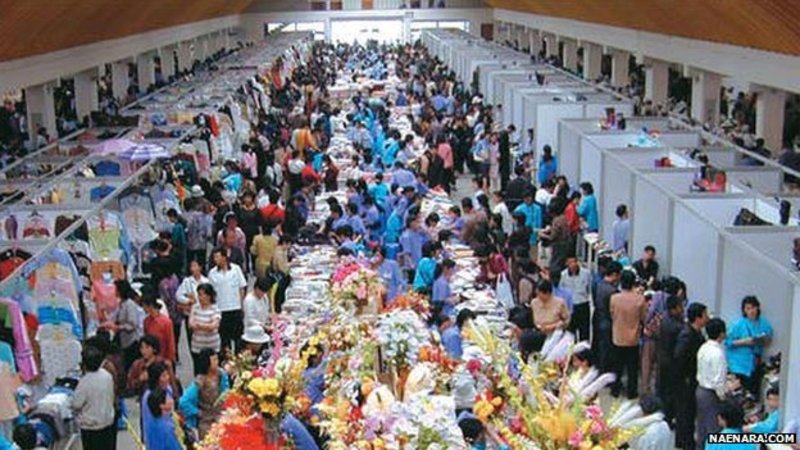
‘Tongil Street Market,’ a state-sanctioned market in Pyongyang. Photo: Naenara.com (2003) |
So perhaps analysis of trade figures will help determine whether the BOK’s estimated four point deceleration in growth is more or less plausible than the SPA’s reported one point acceleration. Regarding inter-Korean trade, the MOU reported that volumes shrank by 7.8% from 2008 to 2009, down to $1679 million84. And regarding Sino-Korean trade, the Chinese Embassy in the DPRK reports that volumes slowed by 4%, for a total of $2.68 billion85. Do these reductions not seem a bit too small to justify the BOK’s claim concerning recession? One has to keep in mind that the reduction in the reportedvalueof the Sino-Korean trade does not necessarily entail a reduction in theamountof goods flowing into the DPRK, given the dramatic reduction in world price for food and oil. Also, the June sanctions likely pushed a sizeable part of Sino-Korean trade in the grey zone of unreported trade. Note, for example, that Chinese customs stopped publishing Sino-Korean trade data from August to November, so that there is no way of verifying the quantity of goods that crossed the Yalu and Tumen rivers in 200986. Even the above-mentioned $2.68 billion figure likely does not tell the whole story. Moreover, it is hard to believe that the DPRK had not foreseen the outcry its nuclear test would cause in May, and accordingly stocked up on necessary goods long before the sanctions hit it in June. Finally, consider that trying to use trade data to justify the BOK’s reported recession backfires when discussing GDP growth for later years. If a reduction of Sino-Korean trade volumes from $2.79 to $2.68 billion could reduce GDP growth by 4% in 2009, where would this leave us for 2010 or 2011, when trade volumes leaped respectively to $3.47 billion and $5.63 billion? Surely this suggests that the DPRK’s GDP growth should be substantial at this time. Yet BOK figures inexplicably continue to indicate negative value for 2010 (-0.5%) and only timid growth for 2011 (+0.8%). Would the SPA’s revenue growth figures for 2010 and 2011 not be far more plausible in this case, at respectively 7.7% and 8.6%87? These considerations leave the BOK’s pessimist assessment of the DPRK economy on very shaky ground indeed.
All this makes us wonder about the extent to which the BOK judgment might be influenced by Seoul’s political climate. This would not be the first time that the BOK is the target of such suspicions, as we noted above. It thus becomes relevant to point out that BOK statistics for 2009 were published in June 2010, when inter-Korean relations were at their worst since the end of the Cold War. Relations had already been going downhill since Lee Myung-bak – the first conservative president in fifteen years – assumed power in Seoul in 2008. But it was not until May 2010 that Seoul really cut ties, by halting all inter-Korean trade and investment outside the Kaesong Industrial Complex. The precise justification for these “May 24 measures” was the Cheonanincident, the sinking of a southern corvette that hawks in Seoul have blamed on Pyongyang. A summary of the report coming to this controversial conclusion had been released on May 20th, with the full report only made available to the public in mid-September. Ultimately, Seoul’s accusations failed to convince enough nations internationally to produce unified action88. But in the South, the hawks were cracking down heavily on dissent, silencing growing suspicions among doves that it may all have been a false flag operation designed to discredit the opposition. Why else release only a “summary” just when campaigning started for the June 2ndlocal elections? The government seemed to do everything in its power to control public discourse on the incident, invoking national security to prosecute public critics of the report (or even the skepticism voiced by a former presidential secretary) as libel or “pro-North” propaganda89. In these circumstances, it seems almost too convenient for the hawks that the BOK estimates a weakening of the northern economy, less than a month after doves registered surprising successes in local elections by drumming up support against the trade ban90.
To sum up, too little data is available to solve the 2009 riddle with absolute certainty. We do have reasonable grounds to believe, though, that the economy continued to grow during that year, following a trajectory more in line with the SPA than the BOK assessment. Agriculture may have suffered from the weather, but probably benefited from low oil prices. The currency reform arguably came too late to substantially drag down figures for 2009, and it turns out that the doomsday reporting that surrounded it at the time was mostly exaggerated. The new wave of sanctions was foreseeable and probably added only limited pressure compared to what was already in place. Reported trade, though sluggish, slowed less than expected, and this sluggishness was likely offset by low food and oil prices, as well as unreported trade. In any case, if lethargic trade could really throw the DPRK into a recession, it is hard to see why the BOK would continue to report recession and mediocre growth in 2010 and 2011, when trade was skyrocketing. There thus seems to be no convincing empirical evidence to warrant the BOK’s pessimism. Worse, the atmosphere in Seoul at the time the estimates were published gives rise to concerns that the BOK may have been manipulated for domestic political purposes.If the SPA’s numbers turn out to be accurate, and the trajectory in 2010 and 2011 seems to suggest so, then the DPRK’s growth rate ranks among the fastest in the world in these years.
Conclusion: A New Era?
The theory of the “coming North Korean collapse” is a curiously tenacious myth. It is based on little more than speculation, sometimes aggravated by misinformation, disinformation or wishful thinking. Even the dubious and undervalued statistics commonly cited in the Western and South Korean press hardly support allegations that the DPRK’s socialist economy is slowly disintegrating. On the contrary, comparatively reliable indicators on food and trade suggest that it is recovering and catching up, despite the extremely hostile conditions it has faced since the 1990s.
The evidence suggests that the high growth figures reported by Pyongyang are more plausible than the pessimistic estimates emanating from Seoul. Some changes have been so conspicuous that they could be followed by satellite imagery91, such as the recent construction frenzy92that has seen impressive new housing, health, entertainment and infrastructure facilities mushroom in Pyongyang and other major cities of the DPRK93. Some other changes have been more subtle, and reach us instead through the observations of recent visitors like Rüdiger Frank:
…the number of cars has been growing so much that in the capital traffic lights had to be installed and the famous “Flowers of Pyongyang”—the traffic ladies—had to be pulled off the street lest they get overrun by Beijing taxis, home-madeHuitparamsandSamchollis, the ever-present German luxury brands of all ages and the occasional Hummer. Inline-skating kids are now such a common sight that hardly any visitor bothers mentioning them anymore. Restaurants and shops are everywhere, people are better dressed, more self-confident than two decades ago, and obviously also better fed, at least in the capital. Air conditioners are mounted on the walls of many residential buildings and offices. Everyone seems to have a mobile phone, and there are even tablet computers.In the countryside, too, signs of improving living standards are visible, including solar panels, TV antennas, cars in front of farmer’s houses, shops, restaurants and so forth94.
In fact, the question today in informed circles is not so much whether the DPRK is changing, but whether it can sustain this change in the long-term. Frank, notably, worries that the economy is not yet solid enough to justify such an ongoing spending spree, and draws concerned parallels with the closing years of his native GDR95.
|
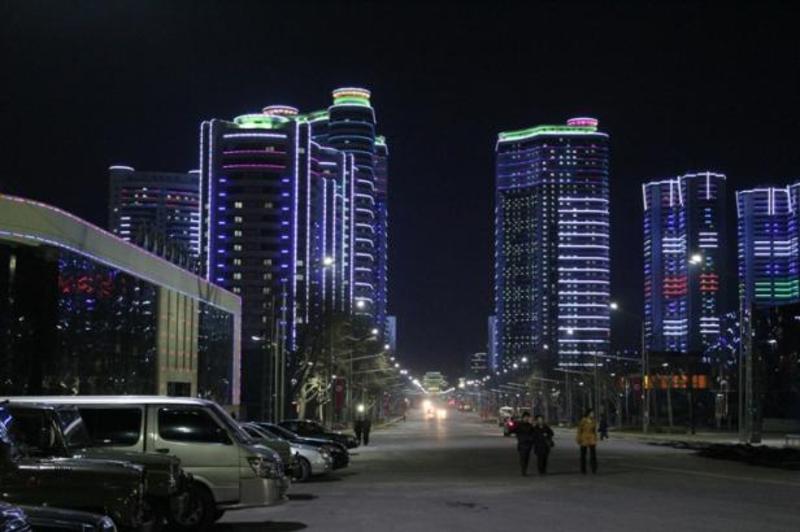
Newly built apartments in downtown Pyongyang. Photo: Lukasz. |
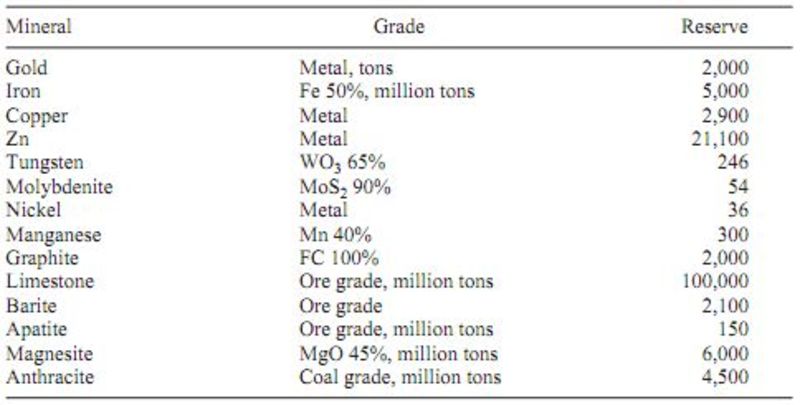
The DPRK, however, has a trump card that may spare it the fate of the GDR – a vast and still largely untapped mineral wealth. The country has literally been called a “gold mine,96“and there is in fact not just gold, but a whole range of extremely valuable mineral resources in the mountains of Korea. According to Choi Kyung-soo, President of the North Korea Resources Institute in Seoul:
North Korea’s mineral resources are distributed across a wide area comprising about 80 percent of the country. North Korea hosts sizable deposits of more than 200 different minerals and has among the top-10 largest reserves of magnesite, tungsten ore, graphite, gold ore, and molybdenum in the world. Its magnesite reserves are the second largest in the world and its tungsten deposits are probably the sixth-largest in the world97.
South Korean reports have estimated the total value of the North‘s mineral wealth at US$ 7 to 10 trillion99. And this was before the largest so-called rare earth element (REE) deposit in the world was discovered in the north of the country, in Jongju, with 216 MT of REEs said to be “worth trillions of dollars” by themselves100.
To be sure, the experiences of countries like Mongolia, Nigeria and Russia show that it is not so much the presence, but the ability to extract and market natural resources that matters. Choi estimates existing mining facilities in the DPRK to operate below 30 percent of capacity because of lack of capital, antiquated infrastructure and regular energy shortages101. And although the DPRK has expressed interest in joint ventures to develop its mining industry, foreign companies appear concerned about the legal guarantees and the general investing environment that the country can offer102.
|
Figure 7: Estimates of the DPRK’s major mineral and coal reserves (per thousand metric tonnes, unless otherwise specified). Source: Korea Resources Cooperation98. |
That being said, the government appears to be taking steps to respond to these challenges. It has, for example, supported mammoth trilateral projects between Moscow, Pyongyang and Seoul (the so-called “Iron Silk Road”) that could link the Russian Far East and the Korean Peninsula with railways, pipelines and electric grids103. Once built, the railway could reduce the time needed for goods to transit between Asia and Europe to just 14 days, instead of 45 days by freight shipping up to now, greatly facilitating trade104. The greater and cheaper access to Russian energy should also prove a boon to the DPRK economy.
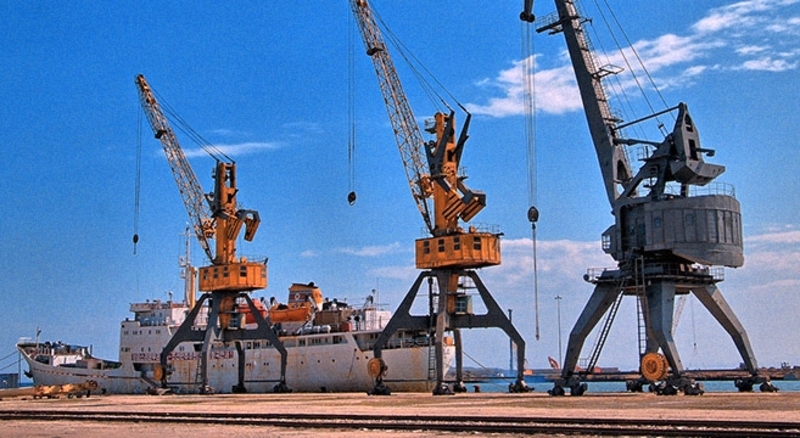
The government has also taken steps to meet investor expectations through the creation of Special Economic Zones (SEZs). Drawing on the Chinese and Vietnamese experiences, SEZs are segregated areas with a favorable legal and fiscal framework specially designed to attract foreign investment. Following establishment of the Rason SEZ as a model, the government has announced plans for new SEZs all over the country. Besides the construction of the Hwanggumpyong and Wihwa islands SEZs on the Sino-Korean border105, it has also been actively setting up fourteen new provincial SEZs106, as well as a “Green Development Zone” in Kangryong and a “Science and Technology Development Zone” in Umjong107. Reports indicate that, besides these, even further SEZ plans may be in the works108. A new SEZ law has also been unveiled, to provide international investors with appropriate frameworks and guarantees109.
The government also appears to encourage companies to approach it for cooperation beyond the SEZs. A good example is the joint venture between the Egyptian telecom provider Orascom (75%) and the Korea Posts and Telecommunications Corporation (25%), which launched the DPRK’s first 3G cellular service in December 2008, reaching a million subscribers by February 2012 and two million by May 2013110.
|
A pier of the Rason SEZ. Photo: NKNews |
Given this potential – as well as the wider evidence presented in this paper – it makes little sense to continue to insist that the DPRK is heading towards economic collapse. If collapse ever threatened the DPRK, it was twenty years ago, not now. This also means that there is just as little sense in continuing to strangle the Korean people through sanctions and diplomatic isolation. These have failed to fulfil any substantial objectives to date, be it regime change or nuclear non-proliferation, and will be even less likely to fulfil them in the future, if the country continues to grow.
In these circumstances, continued sanctions and forced isolation may not be meaningfully contributing to international peace and security. Marginalization has not only failed to “pacify” the country, it even seems to have radicalized it. It is obvious that the more we isolate the DPRK, the more it will want to develop its self-defence capabilities, and the less it will stand to lose from infuriating its neighbours with its nuclear and ballistic research programs. Better integration into the world community would likely be much more effective in shifting its political priorities.
The DPRK, far from being the crazed and trigger-happy buccaneer it is made out to be in international media, is – like many other countries – prioritizes its own safety and prosperity. Since the country insists on its right to self-determination and has apparently found ways to maintain it without collapsing in the face of international power, we should stop senselessly segregating it and instead help it integrate into the global village, by giving it reasonable security guarantees and establishing mutually beneficial trade relations. This is not about “rewarding” the DPRK, but simply about choosing the ounce of prevention that will be worth the pound of cure and opting for a policy that best serves world peace.
|
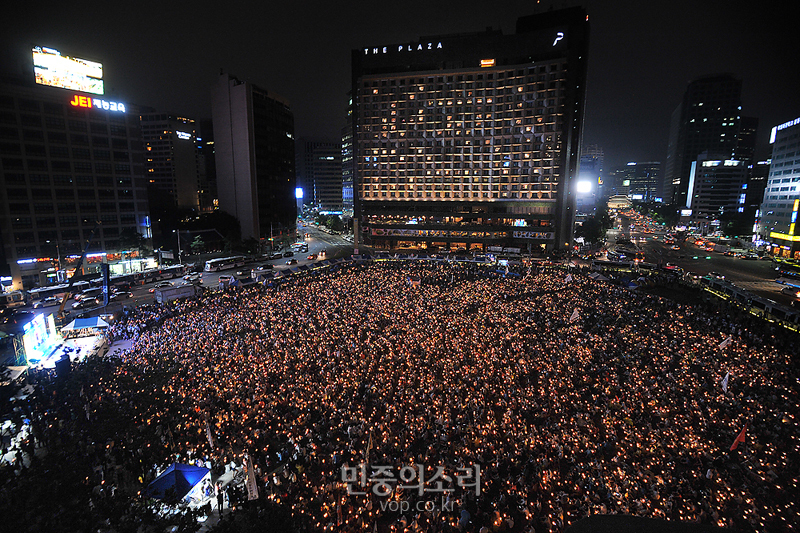
Candlelight vigil on Seoul Plaza in favour of a US-DPRK peace treaty, held on the occasion of the 60th anniversary of the Korean War Armistice Agreement, July 27, 2013. Photo: Lee Seung-Bin / Voice of the People. |
Henri Feron is a Ph.D candidate in international law at Tsinghua University, Beijing, China. He holds an LL.B. in French and English law from Université Paris 1 Panthéon-Sorbonne and King’s College London, as well as an LL.M. in Chinese law from Tsinghua University. He can be reached at [email protected]
Recommended citation: Henri Feron, “Doom and Gloom or Economic Boom? The Myth of the ‘North Korean Collapse'”, The Asia-Pacific Journal, Vol. 12, Issue 18, No. 3, May 5, 2014.
Notes
1 Rüdiger Frank, “A Question of Interpretation: Statistics From and About North Korea,”38 North, Washington, D.C.: U.S.-Korea Institute at SAIS, Johns Hopkins University,July 16, 2012. Retrieved on April 10, 2014.
2 See e.g.Evan Ramstad, “North Korea Strains Under New Pressures”,The Wall Street Journal, March 30, 2010. Retrieved on April 10, 2014; Geoffrey Cain, “North Korea’s Impending Collapse: 3 Grim Scenarios”,Global Post, September 28, 2013. Retrieved on April 10, 2014; Doug Bandow, “The Complex Calculus of a North Korean Collapse”,The National Interest, January 9, 2014. Retrieved on April 10, 2014.
3 See e.g. Soo-bin Park, “The North Korea Economy: Current Issues and Prospects,” Department of Economics, Carleton University (2004). Retrieved on April 10, 2014.
4 World Food Programme. Office of Evaluation, Full Report of the Evaluation of DPRK EMOPs 5959.00 and 5959.01 “Emergency Assistance to Vulnerable Groups,” March 20 to April 10, 2000, p.1. Retrieved on April 10, 2014.
5 Food and Agricultural Organization/World Food Programme,Crop and Food Security Assessment Mission to the Democratic People’s Republic of Korea, November 12, 2012, p.10.Retrieved on April 10, 2014.
6 Food and Agricultural Organization/World Food Programme,Crop and Food Supply Assessment Mission to the Democratic People’s Republic of Korea, June 25, 1998.Retrieved on April 10, 2014.
7 For a summary of unilateral sanctions by the United States of America against the DPRK, refer to: U.S. Department of Treasury, Office of Foreign Assets Control,An Overview of Sanctions with Respect to North Korea, May 6, 2011. Retrieved on April 10, 2014.
8 “Breaking the Bank,” The Economist, September 22, 2005. Retrieved on April 10, 2014.
9 “Ernst & Young says Macao-based BDA clean, cites minor faults,” RIA Novosti, April 18, 2007. Retrieved on April 10, 2014.
10 See Ronda Hauben, “Behind the Blacklisting of Banco Delta Asia,”Ohmynews, May 25, 2007. Retrieved on April 10, 2014; John McGlynn, John McGlynn, “North Korean Criminality Examined: the US Case. Part I,” Japan Focus, May 18, 2007. Retrieved on April 10, 2014; Id., “Financial Sanctions and North Korea: In Search of the Evidence of Currency Counterfeiting and Money Laundering Part II,” July 7, 2007; Id., “Banco Delta Asia, North Korea’s Frozen Funds and US Undermining of the Six-Party Talks: Obstacles to a Solution. Part III,” Japan Focus, June 9, 2007.
11 Daniel L. Glaser, testimony before the Committee on Banking, Housing, and Urban Affairs, U.S. Senate, September 12, 2006. Retrieved on April 10, 2014.
12 Simon Rabinovitch and Simon Mundy, “China reduces banking lifeline to North Korea,” Financial Times, May 7, 2013. Retrieved on April 10, 2014.
13 Simon Rabinovitch, “China banks rein in support for North Korea,” Financial Times, May 13, 2013. Retrieved on April 10, 2014.
14SeeRüdiger Frank, “The Political Economy of Sanctions against North Korea,”Asian Perspective, Vol. 30, No. 3, 2006, at 5-36. Retrieved on April 10, 2014.
15 Ibid.
16 Chad O’Caroll, “How Sanctions Stop Legitimate North Korean Trade,” NK News, February 18, 2013. Retrieved on April 10, 2014 at: http://www.nknews.org/2013/02/how-sanctions-stop-legitimate-north-korean-trade/
17 Ibid.
18 See e.g.Michelle A Vu, “Living conditions in North Korea ‘very bad’,”Christian Today, March 31, 2009. Retrieved on April 10, 2014; Harry de Quetteville, “Enjoy your stay… at North Korean Embassy,”Telegraph, April 5, 2008. Retrieved on April 10, 2014.
19 See, e.g.,“Where the sun sinks in the east,”The Economist, August 11, 2012 (print edition). Retrieved on April 10, 2014; Nicholas Eberstadt, “The economics of state failure in North Korea,”American Enterprise Institute, May 23, 2012. Retrieved on April 10, 2014.
20 Ibid.
21 Mika Marumoto,Project Report: Democratic People’s Republic of Korea Economic Statistics Project(April-December 2008), Presented to Korea Development Institute School of Public Policy and Management and the DPRK Economic Forum, U.S.-Korea Institute at Johns Hopkins University-School of Advanced International Studies. March 2009, at 42. Retrieved on April 10, 2014.
22 United States Central Intelligence Agency, “North Korea”,The World Factbook. Retrieved on April 10, 2014.
23 Ibid.
24 Calculations based on tables in the BOK report for 2012. SeeBank of Korea,Gross Domestic Product Estimates for North Korea in 2012. Retrieved on April 10, 2014.
25Ibid. See also Bank of Korea,Gross Domestic Product of North Korea in 2008. Retrieved on April 10, 2014.
26 BOK, supra note 24.
27 CIA, supranote 22
28 Marumoto,supranote 21, at 48
29 Ibid., at 58-63.
30 CIA,supranote 22
31 The DPRK does not now participate in global Human Development Index (HDI) calculations, which would be a better measure of development than GDP as it includes life expectancy, education and standard of living variables. The only HDI figures we have now are based on 1995 data, during the famine that followed the collapse of the socialist bloc. Even then, UN data indicate that the DPRK still had an HDI of 0.766, roughly the same as Turkey (0.782) or Iran (0.758), placing 73rdout of 158, on the verge of leaving the medium HDI category (0.5 – 0.8) for a high HDI one (0.8 – 1). See United Nations Development Programme,Human Development Report 1998, at 20. Retrieved on April 10, 2014.
32 Marcus Noland, “The Black Hole of North Korea”,Foreign Policy, March 7, 2012.
33 Marumoto,supranote 21, at 48
34 Noland, supra note 32
35 Frank, supra note 1
36 Randall Ireson, “The State of North Korean Farming: New Information from the UN Crop Assessment Report,”38 North, Washington, D.C.: U.S.-Korea Institute at SAIS, Johns Hopkins University,December 18, 2013. Retrieved on April 10, 2014.
37 Food and Agricultural Organization/World Food Programme,Crop and Food Security Assessment Mission to the Democratic People’s Republic of Korea, November 25, 2011. Retrieved on April 10, 2014.
38 Food and Agricultural Organization/World Food Programme,Crop and Food Security Assessment Mission to the Democratic People’s Republic of Korea, November 28, 2013. Retrieved on April 10, 2014.
39 Ireson,supranote 36
40 Marumoto,supranote 21, at 58-63
41 Ibid.
42 See,generally, UN Security Council Panel of Experts Established Pursuant to Resolution 1874 (2009), Report, March 6, 2014, S/2014/147. Retrieved on April 10, 2014.
43 Marumoto,supranote 21, at 58-63
44 Ibid.
45 Ibid.
46 Ibid.
47 Ibid.
48 Ibid, at 67-69.
49 Ibid.
50 Ibid.
51 Stephen Haggard and Marcus Noland, “Sanctions Busting,” Peterson Institute of International Economics, June 12, 2012. Retrieved on April 10, 2014.
52 See graphs on the i-RENK database. Retrieved on April 10, 2014 (Korean only).
53 European Union Directorate-General for Trade,European Union, Trade in Goods with North Korea, November 7, 2013.
54 CIA,supranote 22
55 See graphs on the i-RENK database. Retrieved on April 10, 2014 (Korean only).
56 “Inter-Korean trade hits 8-year low in 2013,”Yonhap News Agency, February 23, 2014.
57 “Trade between N. Korea, China hits record $6.45 bln in 2013,”Yonhap News Agency, February 1, 2014.
58 Aidan Foster-Carter, “South Korea has lost the North to China,”Financial Times, February 20, 2014.
59 The National Committee on North Korea, DPRK-Japan Relations: A Historical Overview, December 1, 2011. Retrieved on April 10, 2014.
60 Scott A. Snyder, “North Korea’s Growing Trade Dependency on China: Mixed Strategic Implications,” Council on Foreign Relations, June 15, 2012. Retrieved on April 10, 2014.
61 Aidan Foster-Carter, “Budget Blanks and Blues,”38 North, Washington, D.C.: U.S.-Korea Institute at SAIS, Johns Hopkins University,June 26, 2012. Retrieved on April 10, 2014.
62 Frank,supranote 1
63 Ibid.
64 Ibid.
65 Ibid.
66 Ibid.
67 Seetables on the FAO website. Retrieved on April 10, 2014.
68 Food and Agricultural Organization/World Food Programme,Crop and Food Security Assessment Mission to the Democratic People’s Republic of Korea, November 16,2010. Retrieved on April 10, 2014.
69 “N.Korea backtracks as currency reform sparks riots”,The Chosun Ilbo, December 15, 2009. Retrieved on April 10, 2014.
70Ibid.
71 Alexandre Mansourov, North Korea: Changing but Stable,38 North,Washington, D.C.: U.S.-Korea Institute at SAIS, Johns Hopkins University, May 1, 2010. Retrieved on April 10, 2014.
72Ibid.
73 Blaine Harden, “North Korea revalues currency, destroying personal savings,” Washington Post, December 2, 2009. Retrieved on April 10, 2014.
74 Bank of Korea,Gross Domestic Product of North Korea in 2009. Retrieved on April 10, 2014.
75 Bank of Korea,Gross Domestic Product of North Korea in 2008. Retrieved on April 10, 2014.
76 Bank of Korea,supranote 74
77 “New N.Korean Currency Sees Runaway Inflation,”The Chosun Ilbo, January 6, 2010. Retrieved on April 10, 2014.
78 The FAO CFSAR for 2010/2011 reports that the 4.48 mMT production for that harvesting year was up 3% compared to 2009/2010, meaning the latter harvesting year’s production was about 4.35 mMT. The difference with the BOK’s 4.1 mMT might be explainable by the FAO’s inclusion of winter crops in its figure. FAO,supranote 68
79 Patrick Worsnip, “North Korea maneuvers to evade U.N. sanctions: experts,”Reuters, November 18, 2009. Retrieved on April 10, 2014.
80 “N.Korea Climbs Down Over Anti-Market Reforms,”The Chosun Ilbo, February 11, 2010. Retrieved on April 10, 2014.
81See“Chaos in North Korea Coverage,”38 North, U.S.-Korea Institute at SAIS, Johns Hopkins University, June 2, 2010. Retrieved on April 10, 2014.
82 Meihua Jin, “DPRK at Economic Crossroads,”China Daily, December 22, 2010. Retrieved on April 10, 2014.
83 Ibid.
84 Ministry of Unification (Republic of Korea), White Paper on Korean Reunification, 2013, p.86. Retrieved on April 10, 2014.
85 Embassy of the PRC in the DPRK,Zhongchao Jingmao Gaikuang, July 20, 2010. Retrieved on April 10, 2014 (Chinese only)
86 Note that this has lead the i-RENK database to record Sino-Korean trade volumes at nil during this period, indicating those volumes to amount toto $1.71 rather than $2.68 billion. This one billion dollar difference creates the wrong impression that Sino-Korean trade levels were in free-fall due to the sanctions.SeeChris Buckley, “China hides North Korea trade in statistics,”Reuters, October 26, 2009. Retrieved on April 10, 2014;see also graphs here (in Korean only)
87 Frank, supra note 1
88 This is neither the time nor the place to review the truth behind the sinking, but suffice to say that Pyongyang proposed to prove its innocence by sending a team to review the evidence (Seoul refused), that Moscow concluded in its own report that a stray mine was a more plausible cause, and that the UN Security Council found Seoul’s version too inconclusive to point any fingers.See“N.Korea’s reinvestigation proposal alters Cheonan situation”,The Hankyoreh, May 21, 2010. Retrieved on April 10, 2014; “Russia’s Cheonan investigation suspects that the sinking Cheonan ship was caused by a mine in water”,The Hankyoreh, July 27, 2010. Retrieved on April 10, 2014; “Presidential Statement: Attack on Republic of Korea Naval Ship ‘Cheonan'”. United Nations Security Council (United Nations). 9 July 2010. S/PRST/2010/13. Retrieved on April 10, 2014.
89 See Barbara Demick and John M. Glionna, “Doubts surface on North Korea’s role in ship sinking,”Los Angeles Times, July 23, 2010. Retrieved on April 10, 2014; “Ex-Pres. Secretary Sued for Spreading Cheonan Rumors”,The Dong-A Ilbo, May 8, 2008. Retrieved on April 10, 2014; John M. Glionna,“South Korea security law is used to silence dissent, critics say,”Los Angeles Times, February 5, 2012. Retrieved on April 10, 2014; Ronda Hauben, “Netizens question cause of Cheonan tragedy,” Ohmynews, June 8, 2010. Retrieved on April 10, 2014.
90 Blaine Harden, “President’s party takes hits in South Korean midterm elections,”Washington Post, June 3, 2010. Retrieved on April 10, 2014; Donald Kirk, “At polls, South Korea conservatives pay for response to Cheonan sinking,”Christian Science Monitor, June 3, 2010. Retrieved on April 10, 2014.
91 See e.g. Curtis Melvin, “North Korea’s construction boom,”North Korean Economy Watch,May 21, 2009. Retrieved on April 10, 2014.
92 Jack Kim and James Pearson, “Insight: Kim Jong-Un, North Korea’s Master Builder,”Reuters, November 23, 2014. Retrieved on April 10, 2014.
93 Rüdiger Frank, “Exhausting Its Reserves? Sources of Finance for North Korea’s ‘Improvement of People’s Living’,”38 North, Washington, D.C.: U.S.-Korea Institute at SAIS, Johns Hopkins University,December 12, 2013. Retrieved on April 10, 2014.
94 Ibid.
95 Ibid.
96 Leonid A. Petrov, “Rare Earth Metals: Pyongyang’s New Trump Card,”The Montreal Review, August 2010. Retrieved April 10, 2014.
97 Choi Kyung-soo, “The Mining Industry in North Korea”,NAPSNet Special Reports, August 4, 2011. Retrieved on April 10, 2014.
98 Korea Resources Cooperation, Current Development Situation of Mineral Resources in North Korea (2009), xii. As cited in Choi, supra note 97.
99 “‘N.K. mineral resources may be worth $9.7tr’,”The Korea Herald, August 26, 2012. Retrieved on April 10, 2014; “N. Korea possess 6,986 tln won worth of mineral resources: report”,Global Post, September 19, 2013. Retrieved on April 10, 2014.
100 Frik Els, “Largest known rare earth deposit discovered in North Korea”,Mining.com, December 5, 2013. Retrieved on April 10, 2014.
101 Choi, supra note 97
102 Ibid.
103 See Georgy Toloroya, “A Eurasian Bridge Across North Korea?,”38 North., Washington, D.C.: U.S.-Korea Institute at SAIS, Johns Hopkins University, November 22, 2013.Retrieved on April 10, 2014.
104 “Putin lobbies for ‘Iron Silk Road’ via N. Korea, hopes political problems solved shortly,” Russia Today, November 13, 2013. Retrieved on April 10, 2014.
105 “China, DPRK meet on developing economic zones in DPRK,”Xinhua,August 14, 2012. Available here. As cited in The National Committee on North Korea,Special Economic Zones in the DPRK, January 14, 2014. Retrieved on April 10, 2014.
106 The zones are the North Pyongan Provincial Amnokgang Economic Development Zone; the Jagang Provincial Manpho Economic Development Zone; the Jagang Provincial Wiwon Industrial Development Zone; the North Hwanghae Provincial Sinphyong Tourist Development Zone; the North Hwanghae Provincial Songrim Export Processing Zone; the Kangwon Provincial Hyondong Industrial Development Zone; the South Hamgyong Provincial Hungnam Industrial Development Zone; the South Hamgyong Provincial Pukchong Agricultural Development Zone; the North Hamgyong Provincial Chongjin Economic Development Zone; the North Hamgyong Provincial Orang Agricultural Development Zone; the North Hamgyong Provincial Onsong Island Tourist Development Zone; the Ryanggang Provincial Hyesan Economic Development Zone; and the Nampho City Waudo Export Processing Zone.See“Provincial Economic Development Zones to Be Set Up in DPRK,”KCNA, November 21, 2013. Available here. As cited in NCNK,supranote 105
107 State Economic Development Committee Promotional Video, as cited by Bradley O. Babson, “North Korea’s Push for Special Enterprise Zones: Fantasy or Opportunity?,” 38 North, Washington, D.C.: U.S.-Korea Institute at SAIS, Johns Hopkins University, December 12, 2013.Retrieved April 10, 2014.
108 SeeNCNK,supranote 105
109 See “DPRK Law on Economic Development Zones Enacted,” KCNA, June 5, 2013. Retrieved on April 10, 2014. As cited in NCNK,supranote 105
110 Yonho Kim, “A Closer Look at the ‘Explosion of Cell Phone Subscribers’ in North Korea,” 38 North, Washington, D.C.: U.S.-Korea Institute at SAIS, Johns Hopkins University, Retrieved on April 10, 2014.

